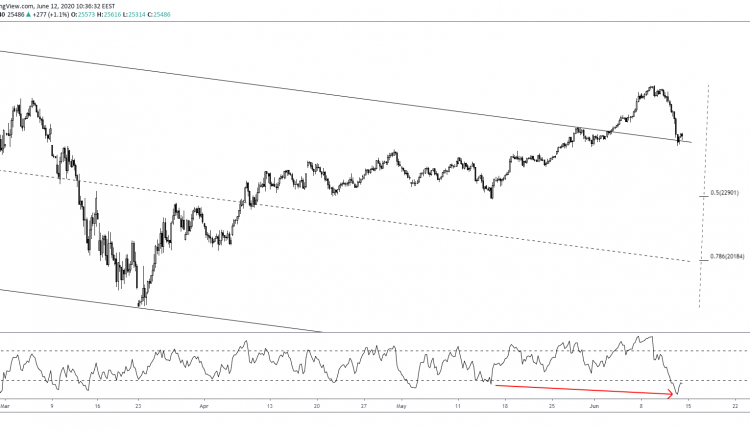
Dow Jones recorded its lowest level in two weeks yesterday at 25070, missing the round support.
Although bulls escaped outside the bearish descending channel starting at 29600 in February, that now resembles a false break.
The recent retest of the upper channel could be spelling a bearish outlook for the index.
Often, the first attempt to either enter or exit a channel fails. This is what we currently see. In case we re-enter the channel in the second attempt, the US30 index could begin a sharp fall towards the 50% and even the 78.6% Fibonacci retracement levels at 22900 and 20180, respectively.

The short-term action will determine the medium-term outlook or at least provide us with additional supportive/rejective clues.
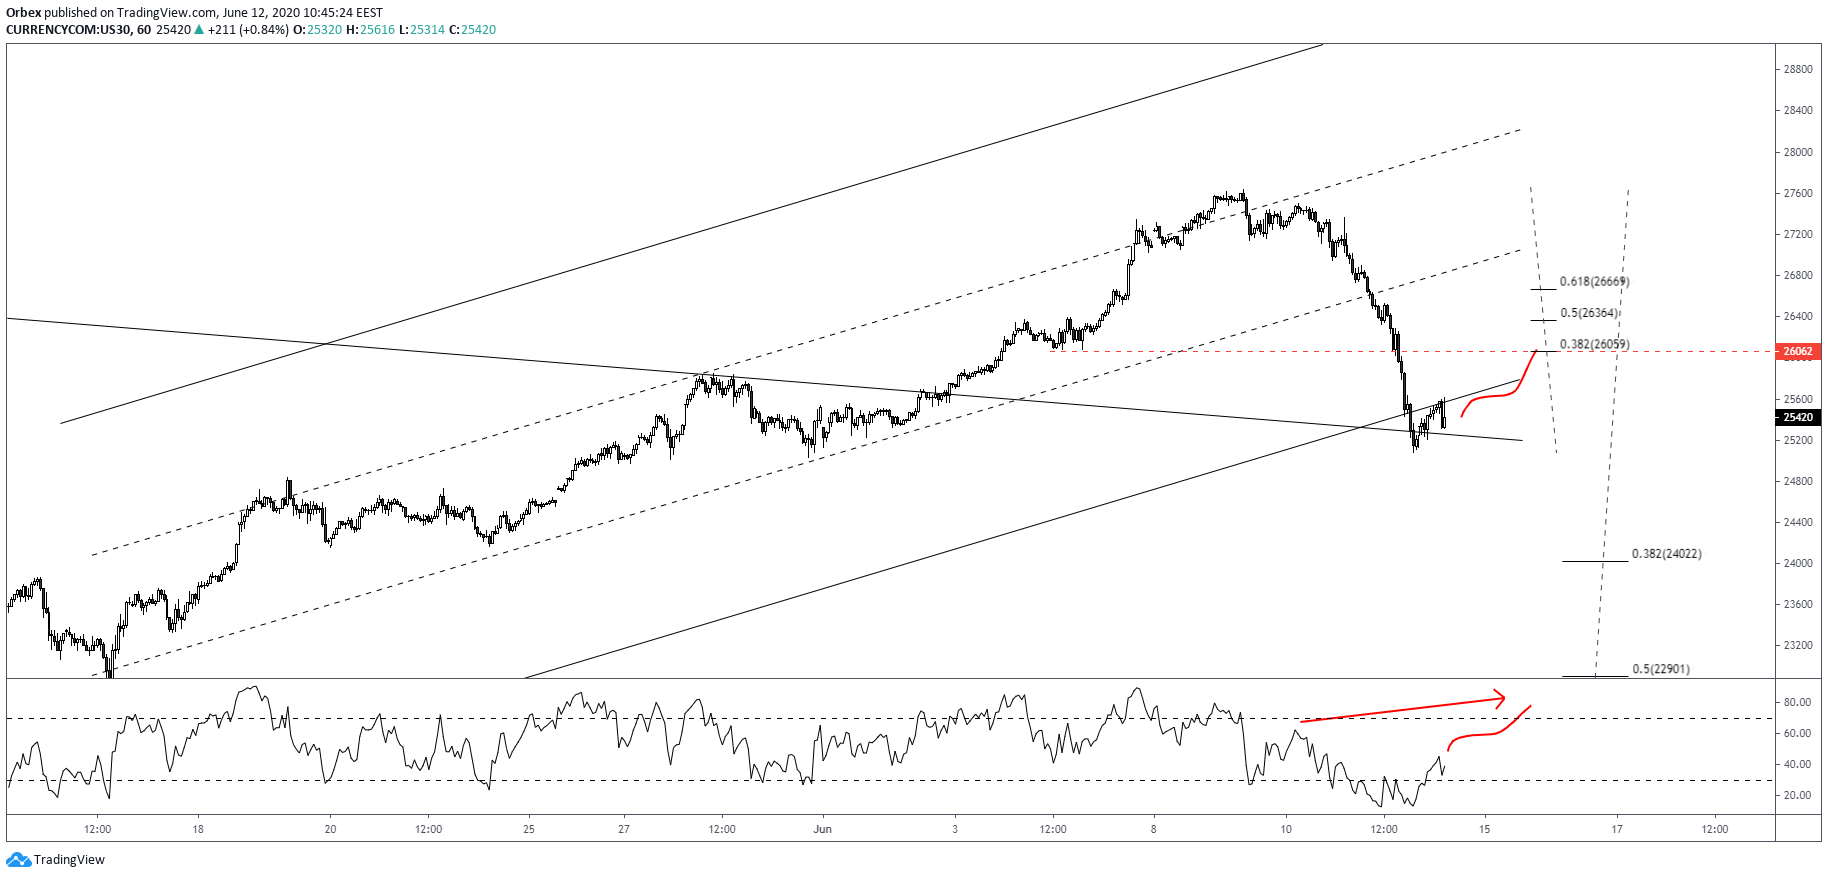
A break could occur either with the immediate break of the upper channel or following a pullback. With the 4H featured chart indicating a bullish RSI(9) hidden-divergence, we could see a move up towards the 26000, or higher, in the 38.2%-61.8% Fibonacci region of the short-term downside leg.
However, when taking into account the short-term bullish regression channel and its recent break, we could see the index rising up to only form a bearish signal on the RSI(9). This means that the lower channel might repeal bulls lower than 26000.
In case a successful breakout takes place, the first target in the shorter-term lies at the 24000 round support. This is the 28.2% Fibonacci of the bullish leg to 27650.

