
Gold is one of the favorite trading instruments in the precious metals asset class. Its appeal ranges from the intraday trader/speculator to investors involved in actual purchasing of the bullion. Well-known for its status as a safe haven currency, some liken gold to the default currency for humanity.
It is no wonder, then, that gold attracts a lot of attention, from fundamental analysis to more technical trading strategies involving gold. This is mainly because gold can be traded in many ways, such as spot gold (XAUUSD), gold futures (GC), gold ETFs (GLD), and even gold (miner) stocks such as Barrick Gold Corp. (ABX) or Goldcorp Inc. (GG). Let’s explore the relationship between gold, the yen, and the USDJPY correlation.
Gold and the Yen correlation

Not widely known among traders, gold is positively correlated with the Japanese yen. Let’s take a look at the first chart, where we compare yen futures to gold futures on a monthly time frame. You can see how gold’s peaks and troughs correspond to those of the yen’s peaks and troughs.
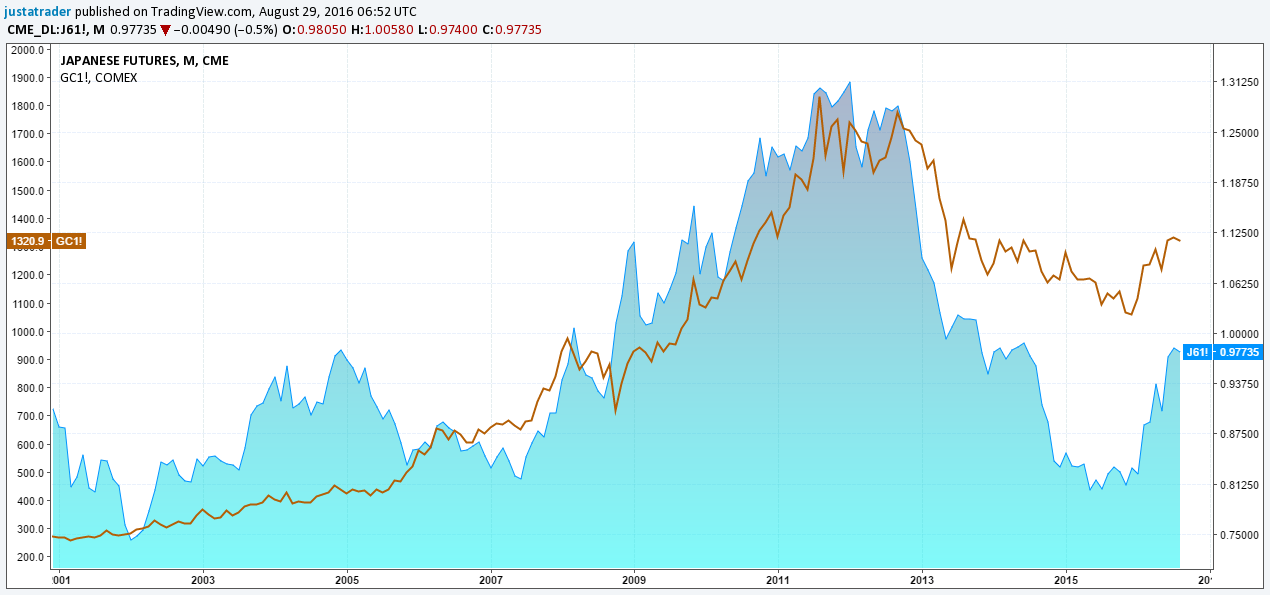
Note: Yen futures are contracts that are priced in US dollars. It is the inverse of USDJPY.
The above chart also shows that the correlation is not 100%. Or in other words, the percentage-to-percentage move or a point–pip basis between gold and yen is not exact. Still, a level of correlation exists that cannot be ignored. You can also see that the level of correlation changes over time.
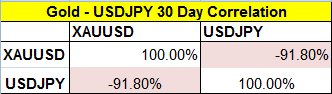
The following image below shows a 30-day correlation between USDJPY and XAUUSD. Notice the -91.8% correlation, meaning that gold and USDJPY tend to move inversely or in opposite directions.
Why is gold correlated to yen?
In reality, there is no proper explanation for this. Although the fact that gold and yen both share the status as a safe haven does, in a way, validate this correlation. But it is merely scratching the surface. Correlations in the markets come and go. A more recent example that traders can recollect was the short-term correlation between oil prices and stocks in the first half of the year, which soon faded. This brings an important point to mention, which is that with any correlation, you cannot take it for granted. Therefore, traders need to constantly, and at regular intervals,check on the correlation between gold and yen. For example, Gold and USDJPY have a correlation of -94% on a weekly basis. However, this fluctuates, and therefore, traders should always keep an eye out for any significant changes.
One could argue that with the USD being common between XAUUSD and USDJPY, the correlation exists. However, this argument fails to hold when looking at other similar currencies, such as EURUSD or USDCHF, for that matter. Up until a certain time, the AUDUSD was correlated to XAUUSD, but the correlation has somewhat weakened, standing at 84% (meaning AUDUSD and XAUUSD are positively correlated).
Another factor that can change the correlation is the Bank of Japan. By means of monetary policy or merely comments, the yen’s exchange rate can be influenced in the short term, which can lead to a shakeout in the correlation, albeit a temporary phase.
Gold and USDJPY trading strategy
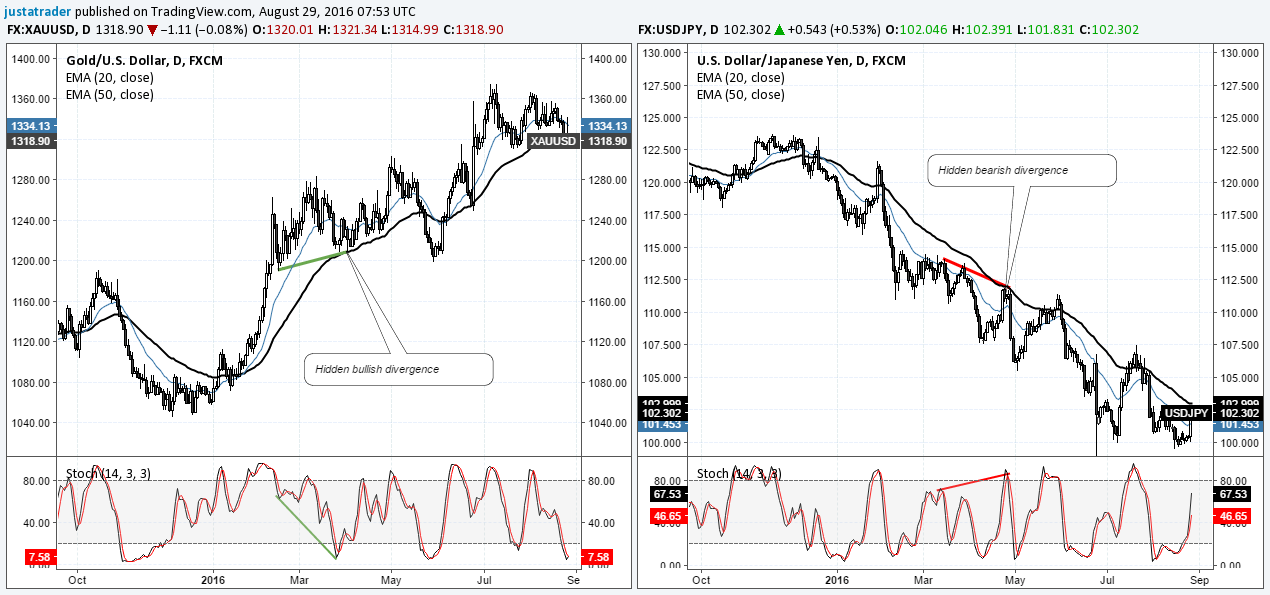
The method and approach to utilizing this information to trade gold and USDJPY are quite open. On a very simple basis, traders can apply their trading strategy to both the instruments and trade when the signals are triggered. The chart below makes use of moving averages and divergence, applied to the gold and USDJPY daily charts.
Here, we can see how gold prices first triggered the hidden bullish divergence, which was later confirmed by USDJPY’s hidden bearish divergence. Broadly put, this indicates that gold’s rally is likely to be complemented by the yen’s rally, thus leading to USDJPY heading lower.
Another approach is to compare the candlestick price action on both charts. Although not always the same, traders can look for patterns such as engulfing or inside/outside bars, as well as the highs and lows that are formed in a trend.
In conclusion, understanding the gold/yen correlation can be of great benefit for traders as it helps to unlock potential trading opportunities that might have been missed if the charts were looked at in isolation. As a reminder, traders should, however, remain cautious on the correlations, which can change at an instant. Paying attention to the fundamentals always helps, and look out for specific comments from central banks (Fed, BoJ) that could bring about some short-term noise in the markets.

