
In the previous article in the Market Sentiment context, we laid out the basic groundwork on what Market sentiment is and how traders can make use of this commonly occurring phenomenon in the markets and thus find themselves in a better position to trade. Market sentiment involves making use of different trading instruments in an effort to find out what investors think will happen next, by combining a mix of technical and fundamental analysis.
For those who haven’t read the previous article, it is worth going back to read and understand the important basics of market sentiment.
How to prepare for the trading week using market sentiment
The first step is to take some time to go through a lot of charts. Therefore, an ideal time to work on Market sentiment analysis is over the weekend where the markets are close and, thus, there are not many market distractions.

In order to prepare for the market sentiment, traders need to look at different charts and build their own analysis based on either price action methods or based on their preferred and trusted trading system.
A basic outline of this type of market analysis is as follows:
- Technical Analysis of the main indices to gauge market sentiment
- Technical Analysis of the currency pairs outlined in the previous articles
- Fundamental Analysis for the week ahead
Technical Analysis – Laying the context
The following charts need to be analyzed first.
- SPX500 or its equivalent (S&P500)
- JPN225 or its equivalent (Nikkei 225)
*Note that the indices must be analyzed and not the futures markets.
Start your analysis with the monthly timeframe, if it is the first trading day of the month, and then switch to weekly, daily and finally 4 or 8 hour chart time frame. Make a quick note of what your technical analysis tells you.
In the first set of charts below, we notice a similar theme. On the 8-hour chart time frame, price action is posted a strong bullish divergence to the RSI and a correction could take prices in the JPN225 towards 19200 – 18800. Likewise, on the S&P500 chart, the same bullish divergence is seen and the correction could rally back to test the resistance at 2000 – 2020. Of course, if price manages to rally above 1890 – 1900 support.
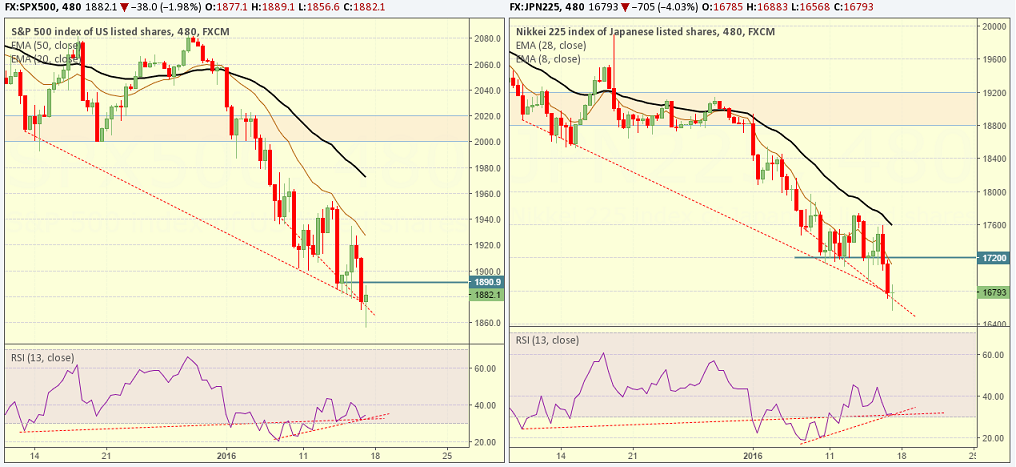
Market Sentiment – Indices Analysis
On the weekly chart for S&P500 and the JPN225, we notice a two-week strong decline following a doji at the top. The EMA’s are close to making a death cross indicating bear markets.
Therefore, from the above analysis we conclude that market sentiment is likely to remain in risk aversion mode in the long term but over the short term (1 or 2 weeks time frame) there is a high chance for a short-term recovery in prices.
Powered by the above analysis, we now know that short term long positions can be taken on risk currencies. The table shown in the previous article gives a good base to pick out the currency pairs most likely to move strongly.
So, in the context of the above analysis, where we expect an equity market correction, we will be looking to trade the following currency pairs.
- AUDJPY: Long positions
- EURUSD: Short positions
- AUDCHF: Long positions
- USDJPY: Long positions
The next step is now to look at the individual currency pairs. A quick overview of the above currency pairs shows the key support/resistance levels where prices are likely to reach within the next 2-weeks.
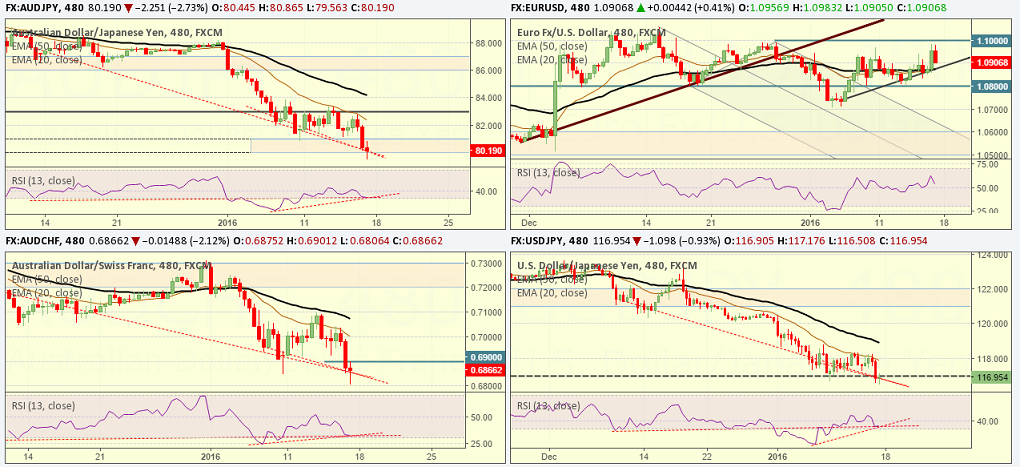
Market Sentiment – Currency Analysis
Thus, based on the above Market sentiment analysis, we have narrowed down our trading week to focus on 4 currency pairs. This makes it a lot easier for traders to manage and also plan their position size management and risk management accordingly.
Now that we have an idea of what to trade and where to trade, the next step is to look at the fundamental overview that shapes the markets over the week.
Fundamental Analysis for the week
Traders can access the fundamental events for the week ahead using any of the free forex or economic calendars available. Simply focus on the main important events for the week. For example, at the time of writing, the fundamental/economic outlook for the week based on high impact that could affect the market sentiment includes:
- China GDP & Industrial production
- Germany CPI
- UK CPI
- UK Jobs report
- Eurozone CPI
- New Zealand GDT
- Canada CPI
- BoC rates decision
- ECB meeting
- The UK retail sales
- Canada retail sales
What does the fundamental analysis tell us?
- Best not to trade CAD crosses due to a lot of data which will keep the currency volatile
- We need to see China GDP beat or match estimates to shift the market sentiment to ‘Risk On’
- ECB’s meeting will be the secondary fundamental data, where we expect the ECB to pull down the Euro (which would give USD a boost)
- The fundamental analysis, therefore, tells us to time our trade closer to the China GDP release. For example, price trading near or above a key support level offers a greater chance of a low-risk entry, especially if the economic data comes out worse than expected.
Trading with Market Sentiment – Conclusion
Now that we have a technical and fundamental landscape, we will revisit the Market Sentiment Analysis in a week and see how our analysis fared.

![Credit Card 160×600 [EN]](https://assets.iorbex.com/blog/wp-content/uploads/2023/06/13144507/Blog-Banner_EN-Banner_160X600X2.webp)