
From last week’s precious metals analysis, we outline two scenarios for Gold.
Bullish Scenario: In this scenario we expected to see a rally back to 1200 on an upside breakout from the falling price channel and on successfully breaking the resistance between 1180 and 1174.25
Bearish Scenario: We noted that with a reversal last week just a few points above 1150, a test back to 1150 was more possible before any further upside corrective moves.
This week, Gold prices saw a sudden sell off early on Monday. Prices not only fell to 1150, but closed even lower to post a fresh 5-year low to 1072.52. While prices have recovered somewhat since, then there was no respite whatsoever as the bearish momentum continues to dictate the market moves. For the week, Gold is currently down -3.5%. Besides the institutional selling, the markets were also saw that China’s build up in Gold reserves were done at a slower pace than expected, although it is hard to buy this story. What is clear however is the fact that precious metals market remains susceptible to ‘fat finger’ selling.

Due to the sudden fall in prices, we prefer to pull out one of the older charts that we had published previously. The daily chart for Gold below shows the median line which has been respected since we first plotted it few months ago.
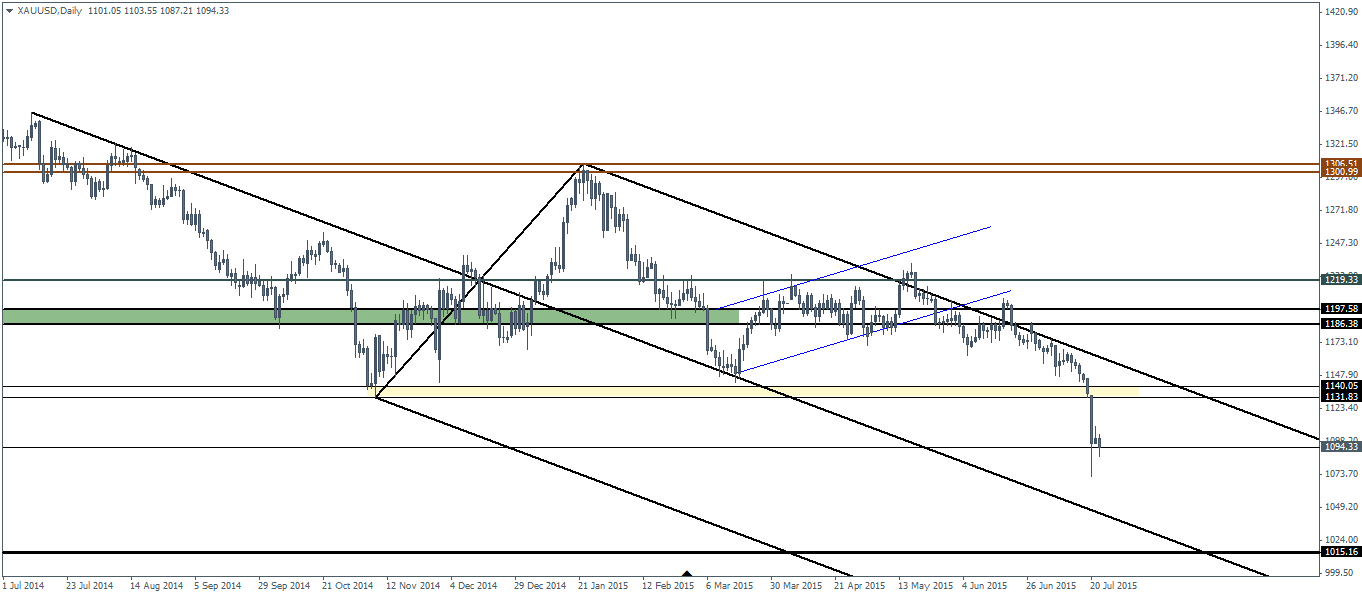
What we notice here is the support level near 1140 – 1131 being cleared on a strong bearish candlestick and prices are currently trading in the void. While it is hard to pinpoint a recovery, conventional median line wisdom tells us that a failure to zoom below the median line but with just a test or a spike could signal a short term reversal. Therefore, watch the median line for any such hints from the market which could signal a push to the upside. The broken support at 1140 – 1131 makes for a very nice price zone that will no doubt attract new sellers into the market. To the downside, Gold remains pressured until it hits the 1015 price objective.
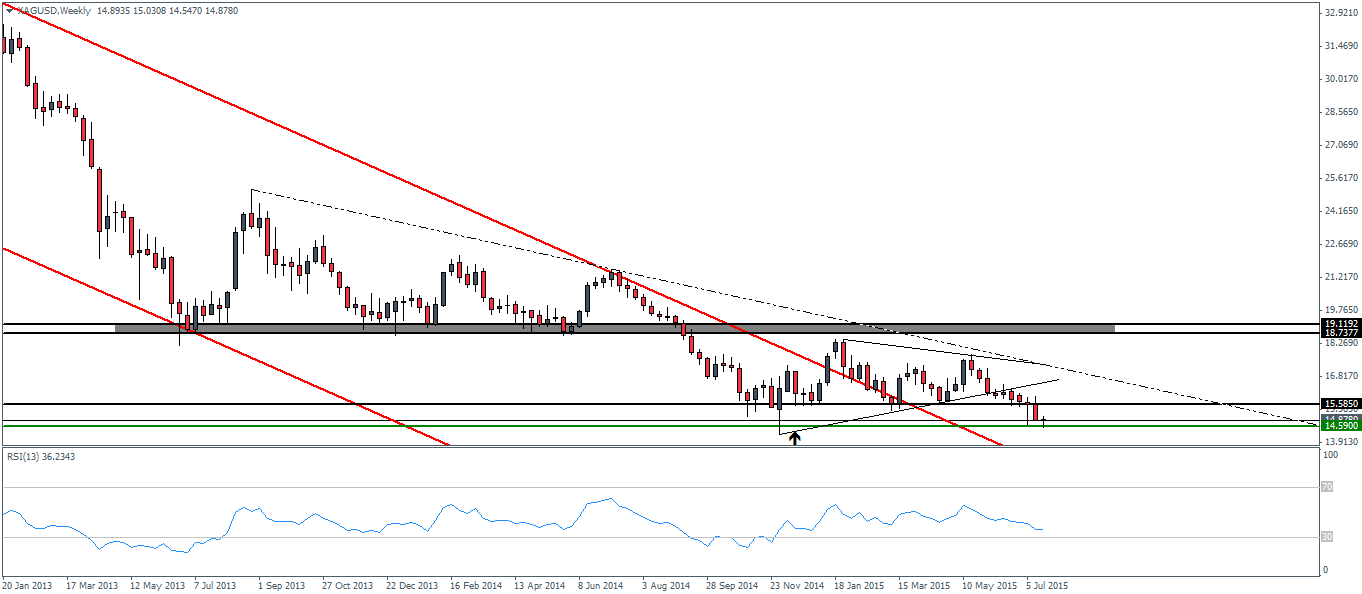
Silver prices were strangely unaffected by the offloading of positions in Gold. Silver continued to trade within the falling price channel as the support zone near 14.95 was cleared and with intermittent spikes towards 14.95 at frequent intervals over the week.
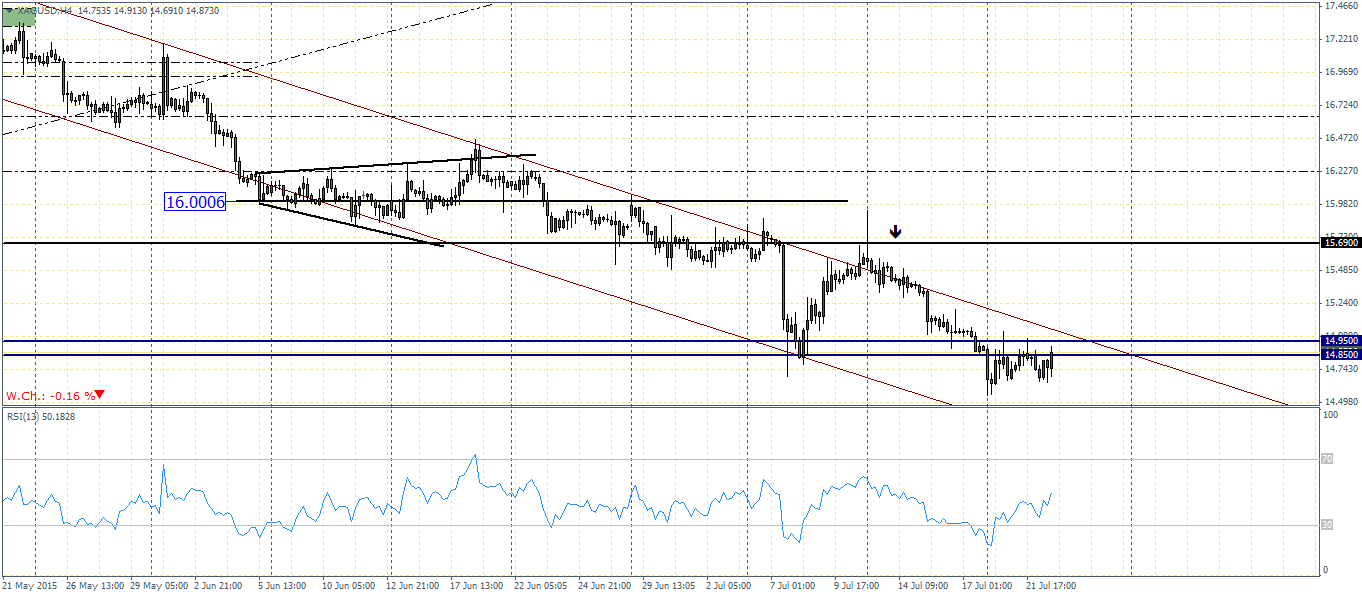
The gradual decline in Silver is however not being confirmed by the RSI as we notice that the indicator is starting to make highs lows while Silver posts lower lows. This brings focus to the 14.95 – 14.85 region, which will be critical. If Silver prices break above this support/resistance zone, Silver could establish support and could post a bullish breakout to the upside, which will see Silver test previous resistance of 15.69. In the event that the zone of 14.95 – 14.85 holds as resistance, Silver could fall lower and post new lows.

![Credit Card 160×600 [EN]](https://assets.iorbex.com/blog/wp-content/uploads/2023/06/13144507/Blog-Banner_EN-Banner_160X600X2.webp)