
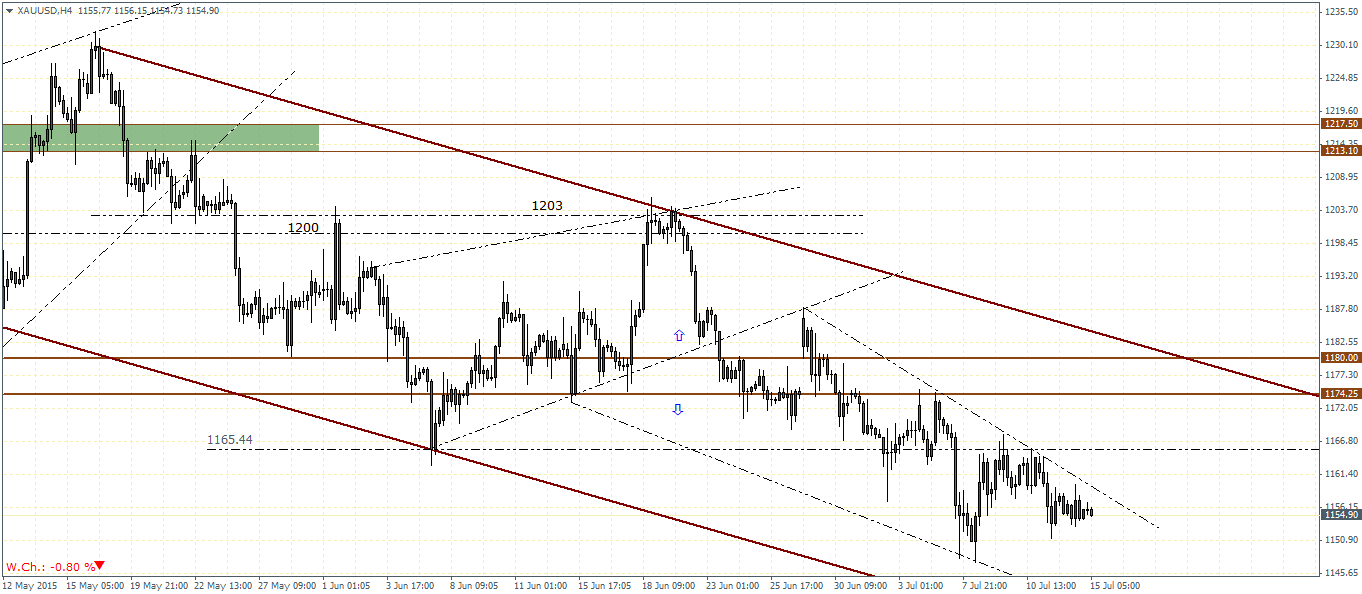
In the previous week’s analysis for Gold, we noted the falling wedge pattern and the potential break out levels with resistance at 1165 and the support at 1150. Over the week, price action managed to briefly rally to test the resistance near 1165 and fell back just above the 1150 handle. The price action in Gold is likely pointing to a strong short term base being formed near the 1150 – 1155 level, which is starting to signal a potential break out to the upside. For the week, Gold prices were down -0.8% and remains range bound off last week’s highs and lows.
A successful close above 1165, will see Gold test the main resistance zone between 1180 – 1174.25 region. A close above 1180 could possibly see Gold attempt a break out from the falling price channel which will then see a major rally to test the 1200 region once again.
Alternatively, if 1180 resistance zone manages to contain the rally, Gold futures could attempt to break the lower support at 1150.

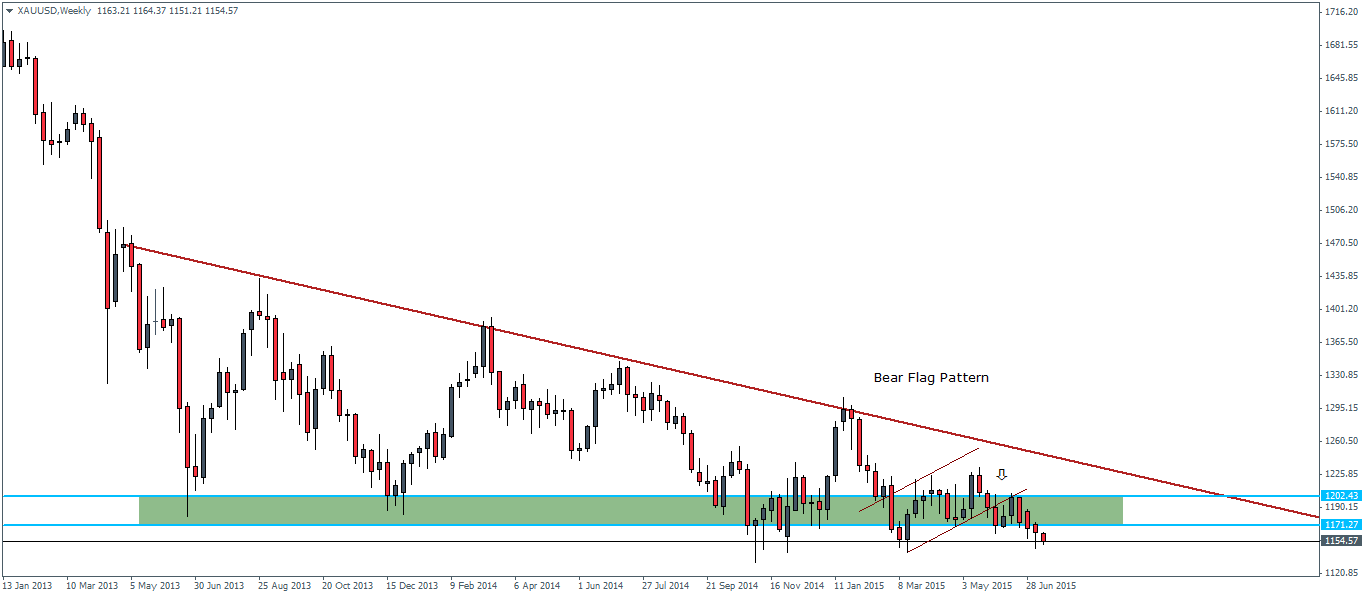
On the weekly chart, we notice that Gold has been declining for close to four weeks straight and we could thus anticipate some kind of a recovery to the losses. On the weekly charts, the main resistance comes in at 1171, which could be a likely price level for Gold to retrace some of its losses. A successful test of resistance at 1170 could potentially bring in new sellers into the market which could see the bearish trend resume once more, this time potentially posting new lows in the Yellow Metal.
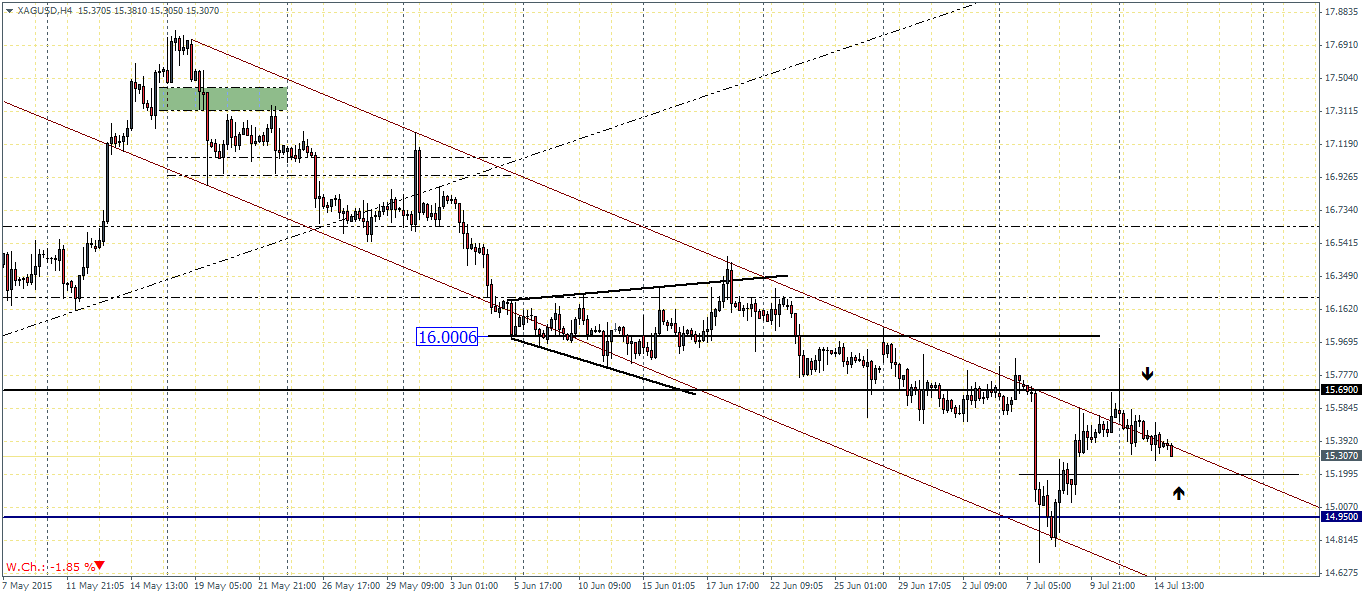
Silver futures managed to bounce off strongly from the $14.95 level of support, which saw prices rally straight up to test the previous resistance at 15.7. This was something which we had anticipated and as mentioned in our last week’s analysis. After the test of resistance, Silver slowed down in its bearish momentum and is currently seen trading near the upper rails of the falling price channel.
For the week, Silver futures were down by -1.7% and is currently trading within last week’s range high and low. There was an attempt to push higher, but prices saw a strong rejection near the highs of 15.67 this week.
In the short term, Silver could potentially test back to 15.2 ahead of an impending break out to the upside. The rally is likely to struggle near 15.7 and 16 region of resistance points in the H4 chart.
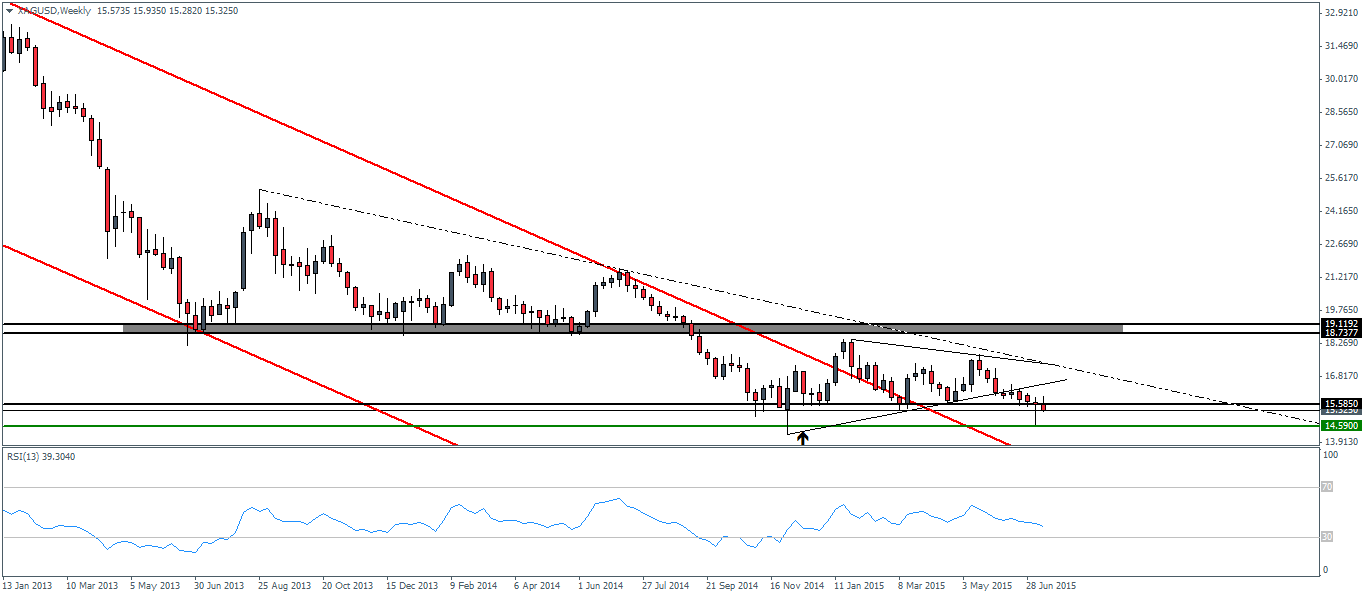
On the weekly charts, price formed a near doji candlestick pattern and a reversal could be confirmed should Silver turn positive for the week. This would mean, Silver prices will have to close above 15.58 level of resistance, or near this week’s open. We however expect a potential test to 14.6 with closing prices as the previous week’s attempt to dip to 14.6 saw a strong rejection near this support.

![Credit Card 160×600 [EN]](https://assets.iorbex.com/blog/wp-content/uploads/2023/06/13144507/Blog-Banner_EN-Banner_160X600X2.webp)