Weekly Forex Technical Outlook – 22nd July
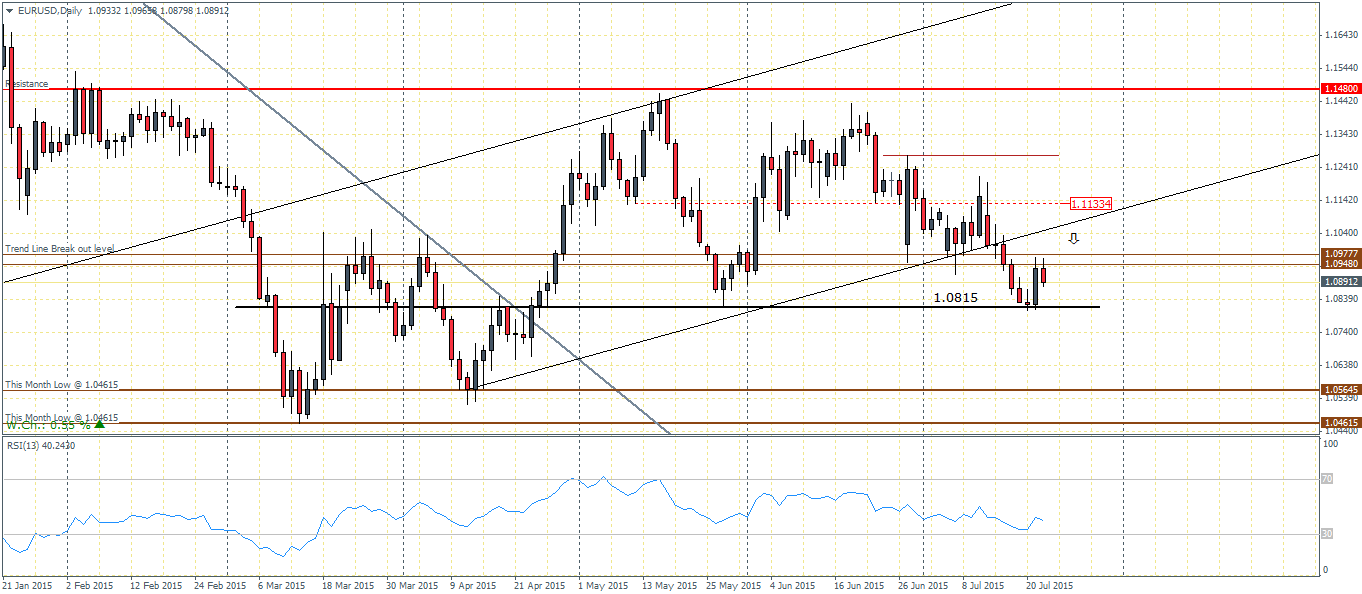
EURUSD (1.089): EURUSD bounced off at the first instance after declining to the support at 1.0815 as noted in our previous week’s analysis. The bounce however saw a sharp rejection near the support/resistance level of 1.0977. Price action is now likely to drive the course as a break below 1.0815 will signal a dip lower towards the next support at 1.05645, while a test of support at 1.0815, if successful could potentially threaten a rally that could break the resistance at 1.0977 and eventually test the next resistance at 1.1133. Regardless, we expect EURUSD to potentially test back the 1.10 psychological levels before continuing its declines.
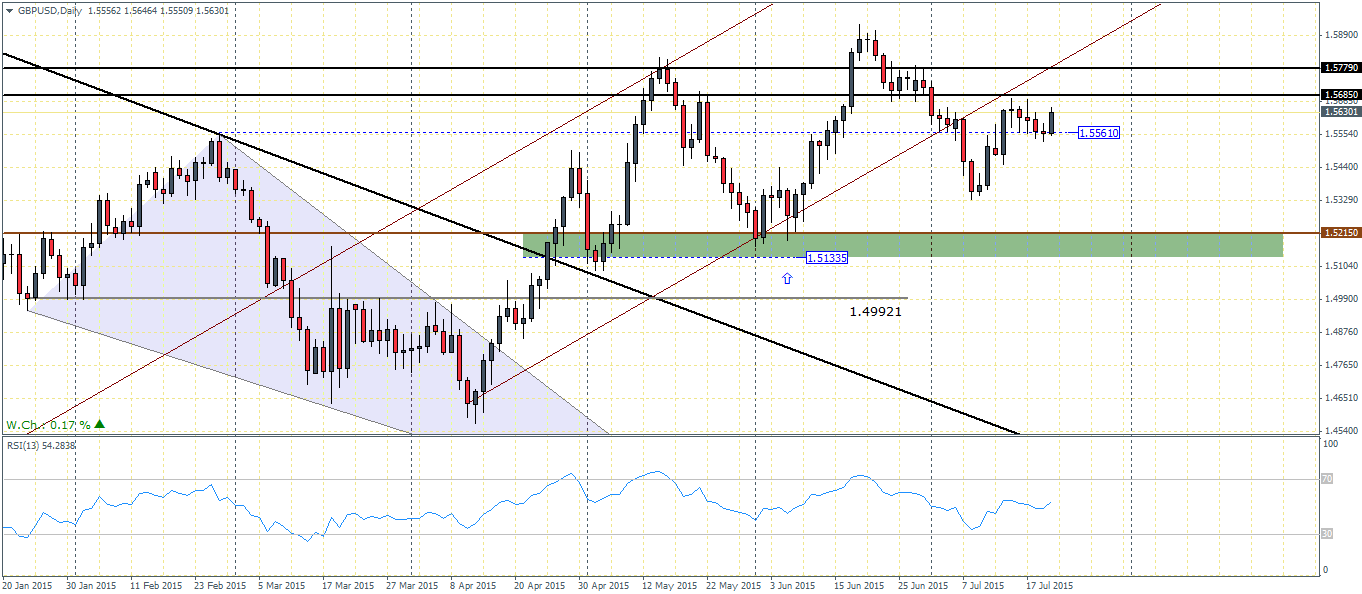
GBPUSD (1.562): GBPUSD has been largely consolidating for the past five daily sessions trading within the range of 1.568 and 1.555. Today’s price action shows a strong support near 1.5561 resulting in a bullish candlestick pattern. However, resistance near 1.5685 and the entire zone up to 1.5779 needs to be cleared for GBPUSD to post new gains. The previous reversal near 1.533 remains exposed as a potential test to this level could be very likely. Should price fail to clear the resistance above, GBPUSD could very well decline lower in the near term with an eye on the previous lows at 1.533 and potentially down to 1.5215.

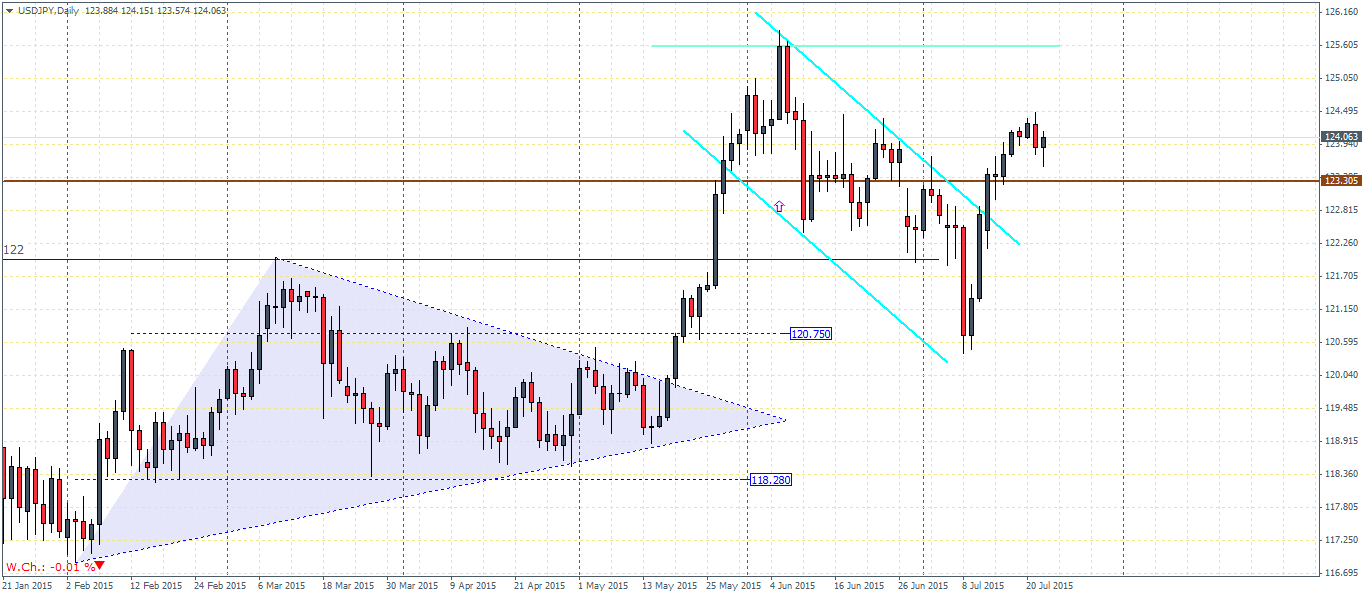
USDJPY (124): The break out from the falling price channel, which marks a major bullish flag pattern has so far cleared the first hurdle, rising above 123.3. We do expect a potential test back to 123.3 to establish a strong support ahead of further gains to the upside which will see USDJPY test 125.6 in the near term. This view is validated by the bearish engulfing candlestick formed on the daily chart yesterday, although there is a potential risk of a bullish continuation in the days ahead. Regardless, 123.3 makes for a strong support level that will no doubt attract fresh buyers into the market.
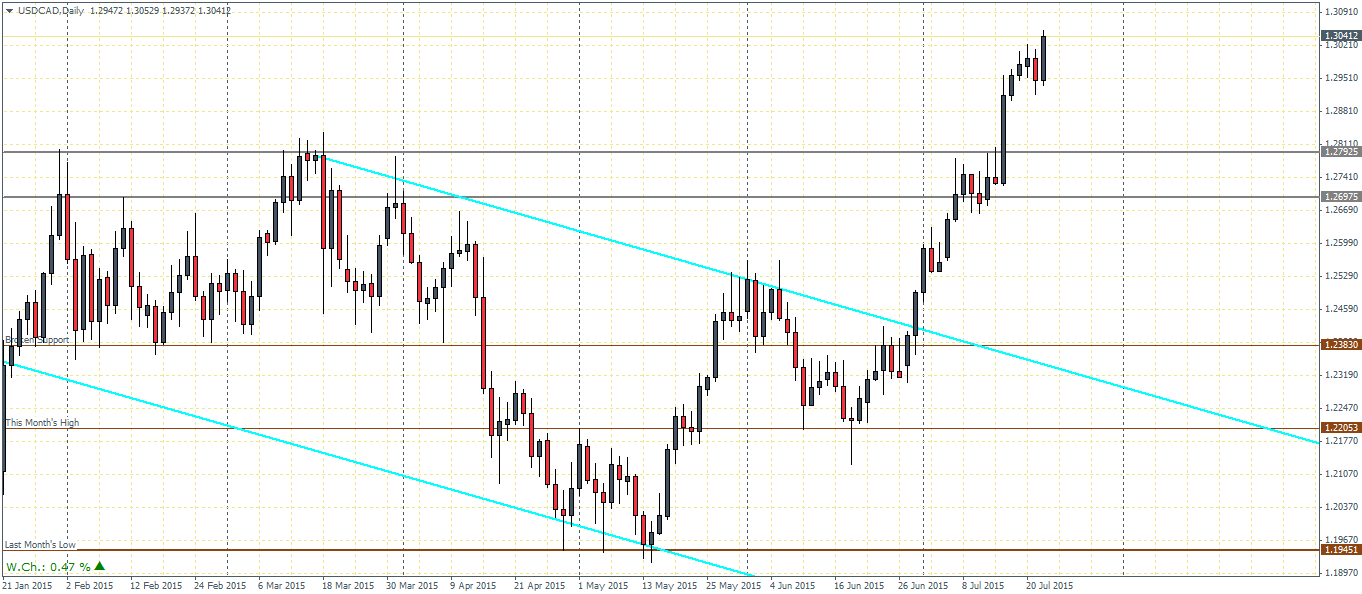
USDCAD (1.303): USDCAD has been one of the currency pairs in a strong uptrend and this was further validated on break of resistance near 1.27925 and 1.26975 with prices breaking on a strong bullish candlestick. However, we do expect a decline back to 1.27925 at the very least for a test of support ahead of further gains. On the longer term, USDCAD will see the next resistance at 1.3336, which is a far way off and thus a dip back to 1.27925 is very likely.
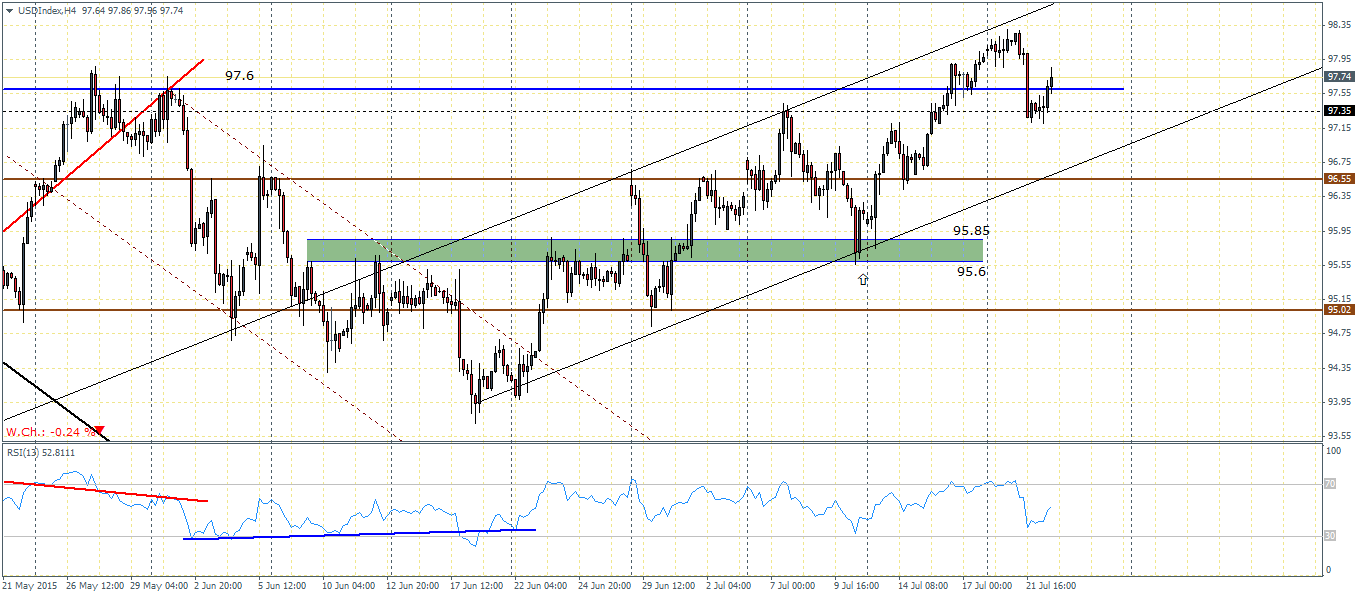
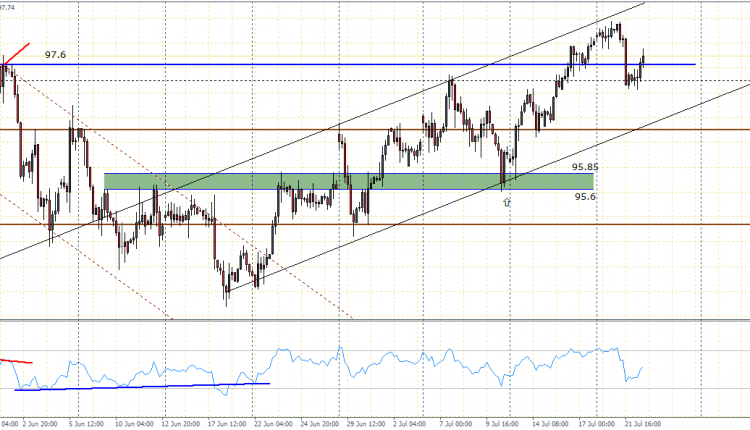
US Dollar Index (97.75): The US Dollar Index retreated after posting a 12 week high near 98.25. The Index fell back to the support near 97.6 through 97.35 and remains biased to the upside within the rising price channel. However, price will now require posting a fresh high, failing which we could see a short term weakness that could potentially push prices lower. In the event that the US Dollar Index fails to find support near 97.35, we could possibly expect to see a decline towards 96.55 where the next support comes in.