
WTI Crude Oil could now see a correction to its short term rally!
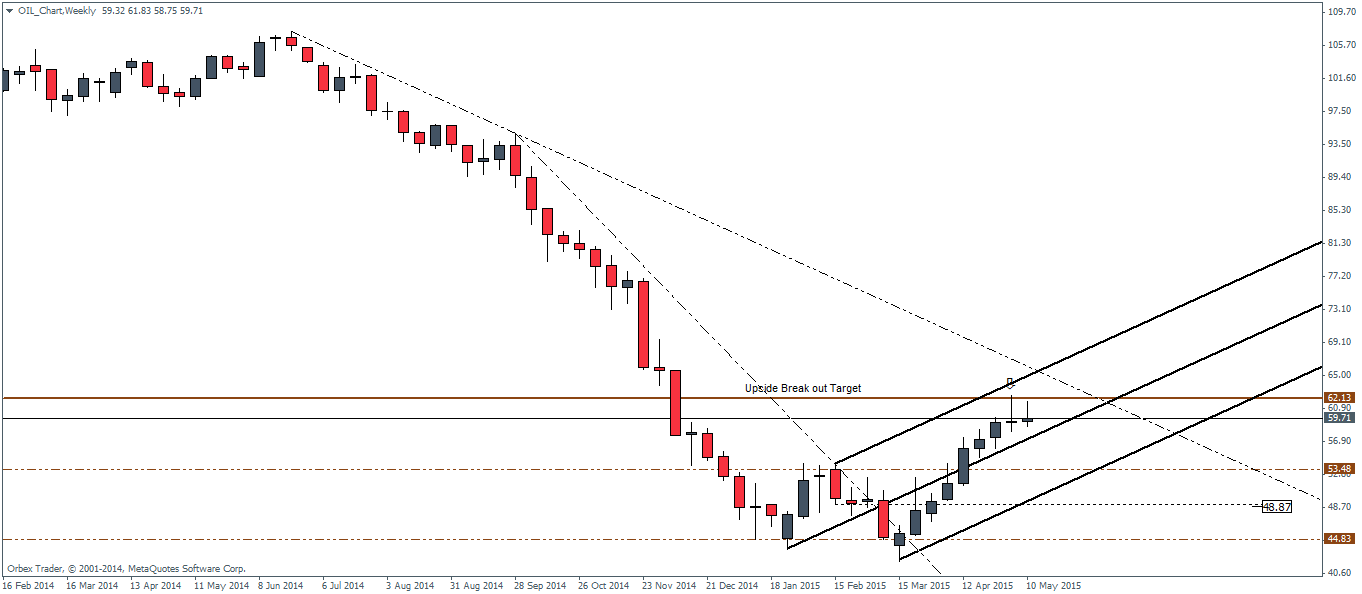
WTI Crude Oil futures has staged an impressive recovery in its prolonged bearish trend with price action last week briefly hitting the $62.13 price point, which we have noted in our previous analysis based off the weekly charts. Last week’s candlestick has closed in an indecision candlestick and in this aspect, the price action on the weekly charts will be of importance. A bullish close will likely see an attempt to break above 62.13, while a bearish candlestick on the weekly charts will see a possible correction or perhaps even a resumption of the bearish trend.
Considering that price briefly spiked to the 62.13, we do expect to see another leg higher to see a more confirmed close at this level. The weekly chart for WTI Crude Oil below shows that price is trading between the upper median line and the median line. We expect any correction to this short term trend on the weekly charts to perhaps find support near the median line in order to see a better close near or above 62.13

Moving to the daily charts, we do notice a couple of interesting candlestick patterns being formed. Firstly we see that price has now broken the rising trend line and just before doing so, formed a very bearish looking shooting star that could also be a near gravestone doji type of a candlestick. This bearish pattern was followed up by a strong bearish candlestick which saw prices eventually touch the previous short term support/resistance level at 58.
With a small bounce after touching 58, price action formed another potential dark cloud cover candlestick pattern which is indicative of a move to the downside.
Given the above, we are of the opinion that WTI Crude Oil could see a decline to 58 support/resistance before it can resume its rally. The daily charts give the next resistance or target at 63.41 through 65.94.
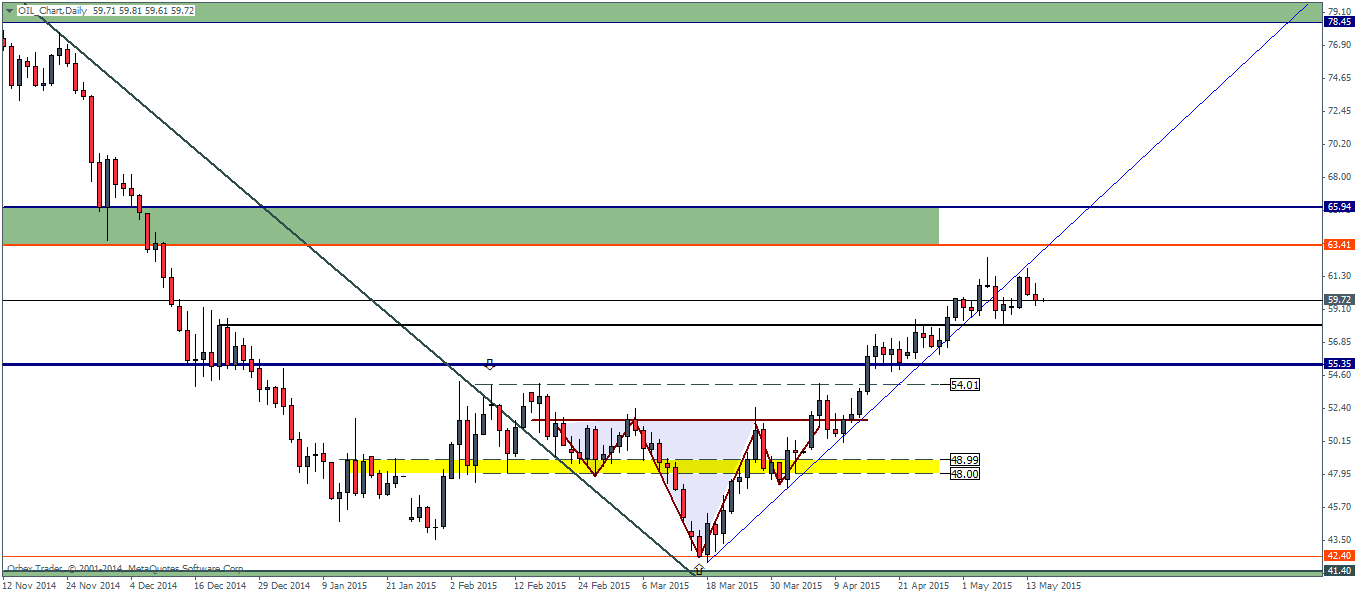
The price action near 58 will be critical as failure to hold the decline at 58 will see prices quickly drop to 55.35 which forms the bigger test for WTI Crude Oil prices.
As long as prices are support near 58 through 55.35 we could expect to see further gains in store, but that might change should we see price fail the 55.35 support level.
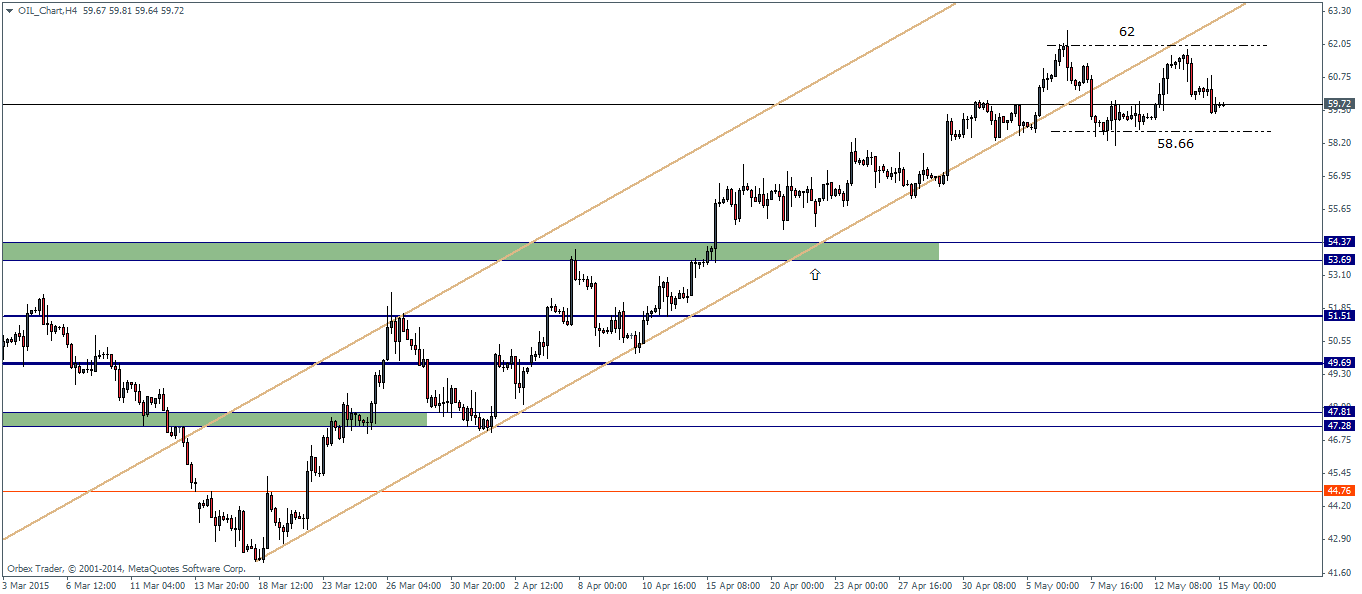
Lastly, a quick scan to the 4-hour time frame shows how prices topped out near the $62 level and an attempt to break above 62 failed. Price has formed a range for itself at 62 and 58.66. A break lower, below 58.66 will see a quick test to 54.37 – 53.59 support level and it seems unlikely at this point for a further rally in Crude Oil.
Fundamentally, nothing much has changed as far as Crude Oil is concerned, leaving us to believe that the current rally in Crude Oil is probably a more technical rally than anything else. As such Crude Oil remains vulnerable to any volatility in the US Dollar. Traders can however keep track of our weekly US Dollar Index technical analysis to understand or expect any possible shifts of sentiment in WTI Crude Oil.

