US Dollar continues its broader decline. 93.8, the next level in sight
The US Dollar has continued to weaken broadly despite last week’s April jobs report managing to come in line with estimates. However, the jobs report wasn’t all that stellar as March numbers were further revised lower to around 86k. The markets were clearly confused as the report did not offer anything valuable to the US Dollar Bulls. Understandably, although the US Dollar has managed to pause in its decline, it is looking like the index is starting to resume its correction.
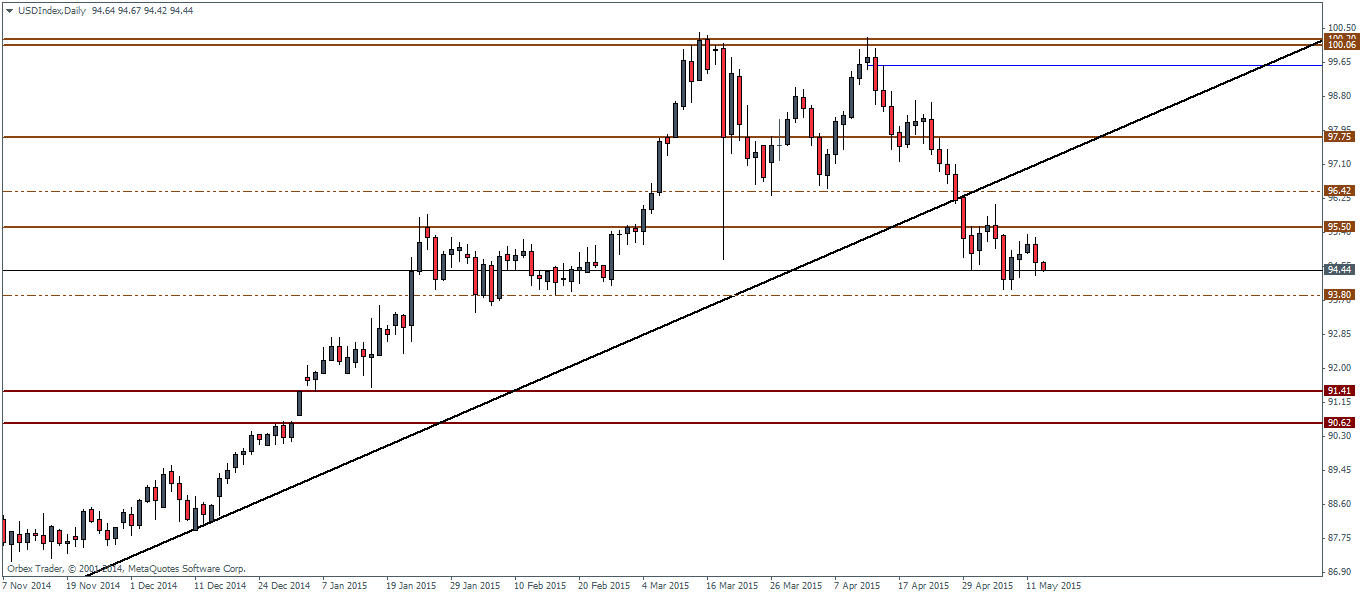
On the daily charts, the next level at 93.80 is the level to watch, after price action failed to break above 95.50. The support at 93.8 has managed to hold prices around early January this year and we could see another period of consolidation once price reaches down to this level.
The main risk to the US Dollar comes with the retail sales data due to be released later today during the US trading session. This report is likely to gain significance as it marks the data for the month of April and any signs of pickup in the retail sales could potentially feed into the second quarter GDP numbers. As such, going with the general theme, only a beat of estimates will help stall the decline in the US Dollar Index.

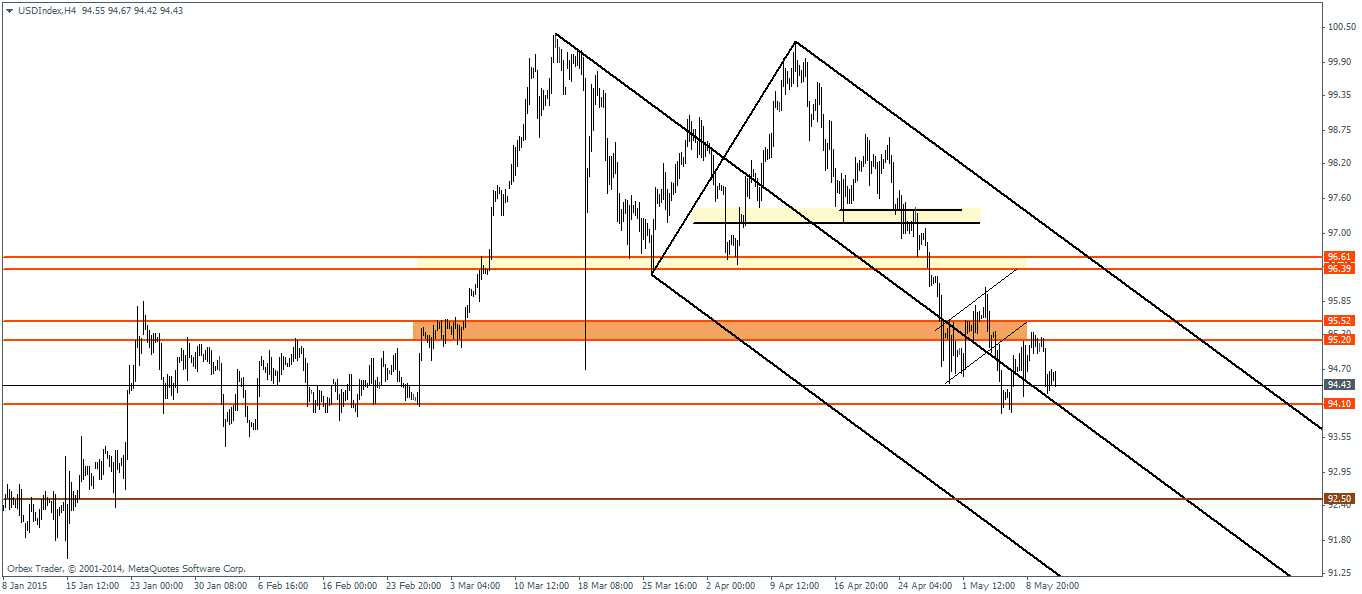
From a technical perspective, 93.80 will be a key level because if prices give way, the Dollar Index could potentially look much lower towards the price levels of 91.4 through 90.6. The 4-hour chart of the US Dollar Index shows the bearish flag pattern being formed few weeks ago. Price action bounced off 94.10 short term support level but failed to break above 95.20. At the time of writing, the Greenback is trading close to the 94.10 level and a break below this zone could see 92.5 be the next price point of interest.
However, as price is trading close to the median line, we would prefer to see a clean cut of the median line to ascertain the views of a decline to 92.5.
From the daily chart shown below, as noted earlier 93.80 will be the level to watch for after yesterday’s candlestick is looking somewhat bearish and comes about three days of gains in the US Dollar Index.
From the weekly charts, we notice that the Greenback has been declining for close to 5 weeks and counting. But a retest to 95.50 looks quite possible from the weekly charts, which should then clear the way for a drop towards the 92 or 91 price levels, which marks the 127.2% Fib extension from the weekly chart’s price move after breaking out from the symmetrical triangle pattern.
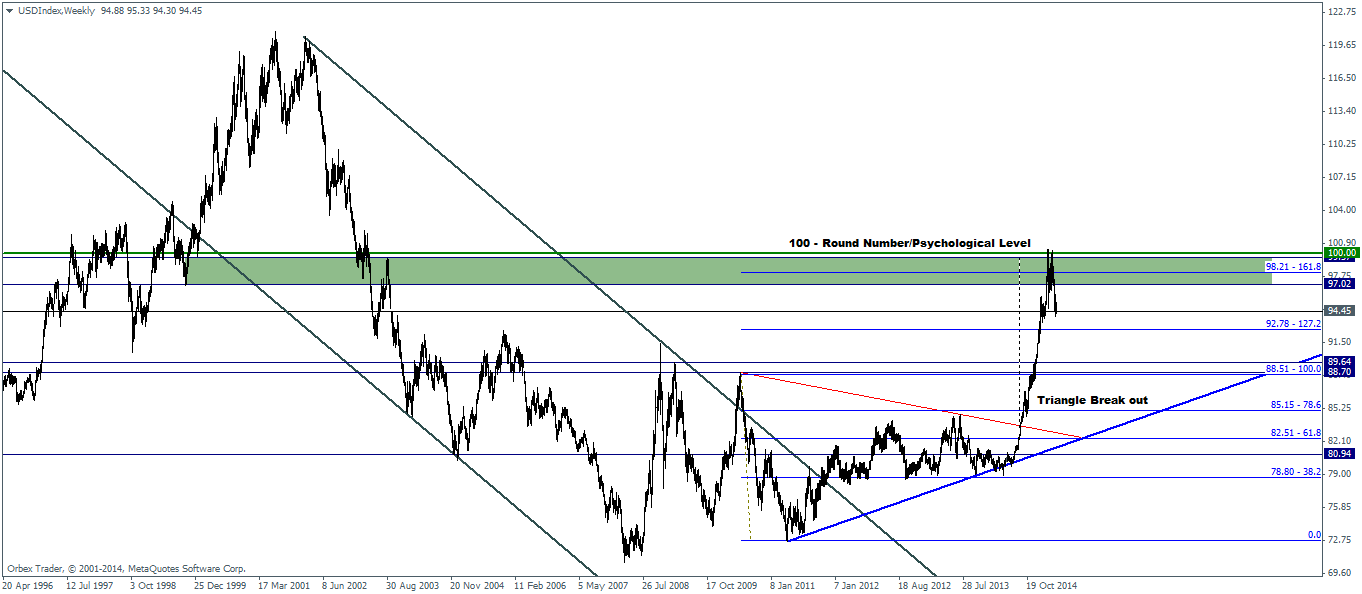
Within the larger scope, we cannot rule out a decline down to 88.5 level as well which shows a strong confluence of previous resistance turned to support as well as a retest of support at this level. In this aspect, the 92.78 will be another level to watch for as a break lower could potentially make the Greenback eye 88.5 in order to complete the correction.

![Credit Card 160×600 [EN]](https://assets.iorbex.com/blog/wp-content/uploads/2023/06/13144507/Blog-Banner_EN-Banner_160X600X2.webp)