
For traders looking for a trend following strategy, there is nothing better and simpler than using the moving average. One of the commonly used indicator, the moving averages form the basis for many different trend following strategies.
In this trading strategy, we make use of the 200 and 50 periods exponential moving average applied to the 4-hour charts. This strategy does not rely on the moving average cross over but rather enters the trend after it is established and exits on a quick profit.
Indicators used and their purpose
200 EMA applied to closing prices on the H4 charts: This forms the main basis of our bias. Because the H4 chart interval closely follows the daily charts, trends are well reflected in this time frame.

50 EMA applied to closing prices on the H4 charts: This moving average will be the key towards managing risks in our trade.
The chart below shows the set up for this strategy.
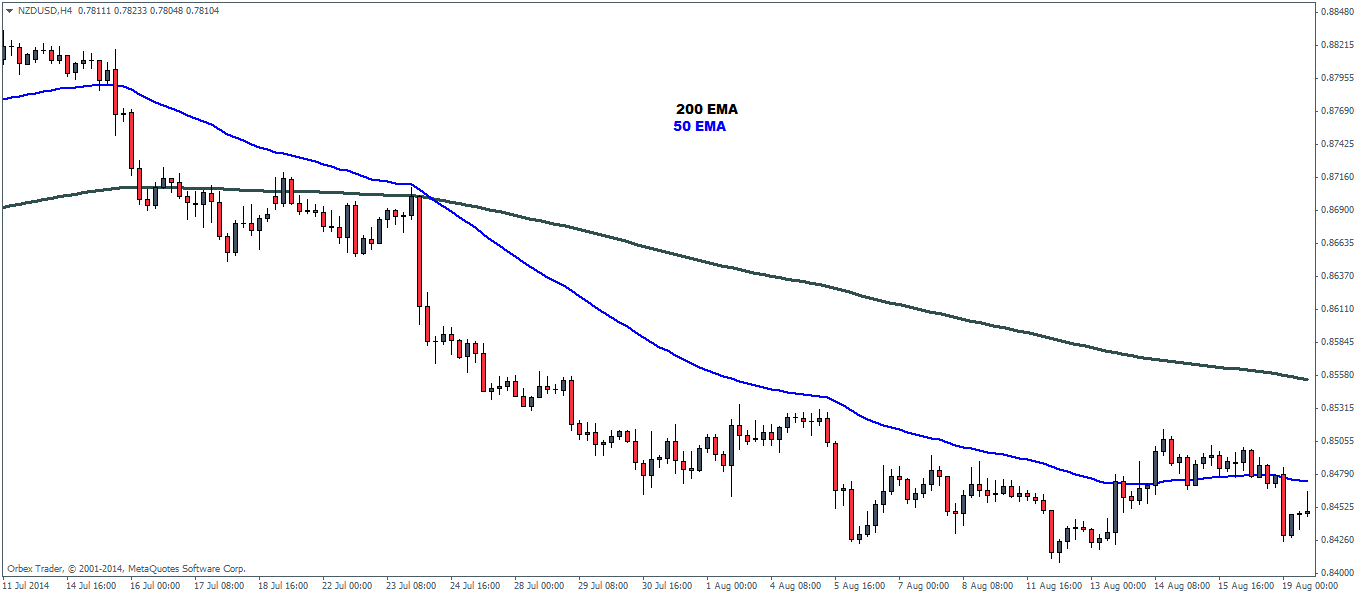
Once the chart is set up, we look for the following criteria:
Sell Bias: 50 EMA must have recently crossed over below the 200 EMA
Buy Bias: 50 EMA must have recently crossed over above the 200 EMA
If either of the conditions is met, we then wait for the following set up to appear:
Sell Criteria
- Price must be trading at or below the 50 EMA
- Price must make a low and then retrace back to make a high, contained within the 200 and 50 EMA
- Using the horizontal line tool, mark the low point before retracement
- Once price breaks this low, wait until a new low is made and price starts to retrace again
- Place a sell order at the previous low with stops above the low at the most visible intermediary high
- Measure the distance of the high to the low and project the distance 1.5 times from entry
The chart below illustrates how the sell trade set up is identified.
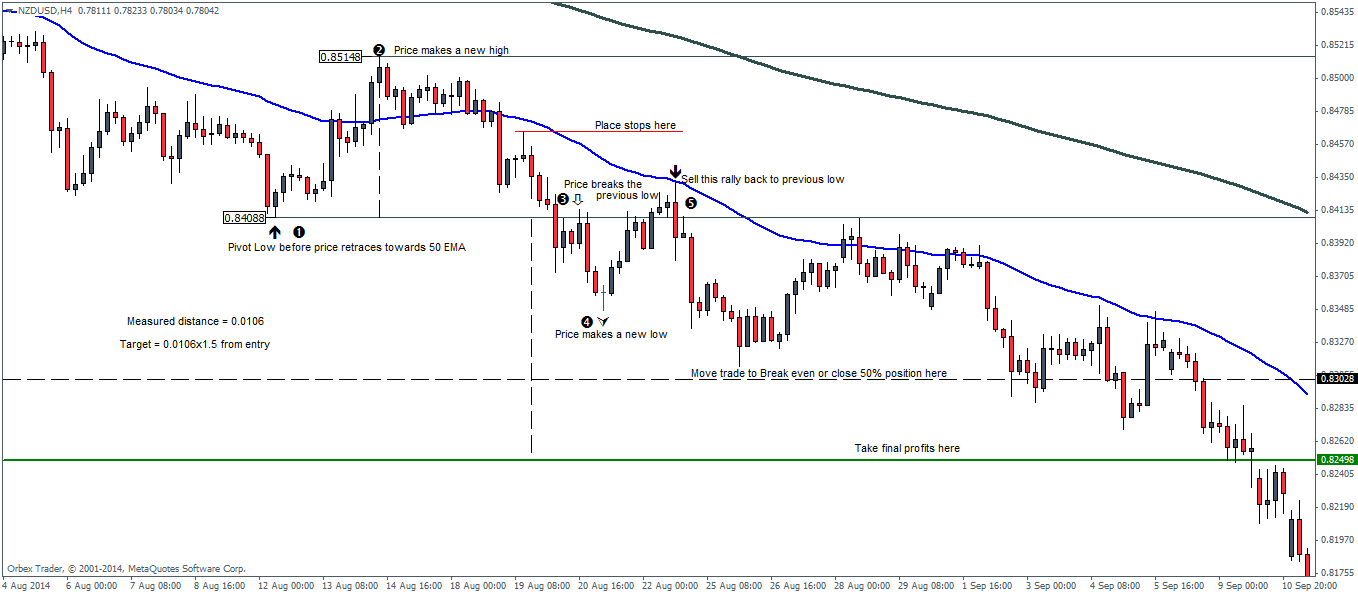
- Price makes a new low at 0.84088 below the 50 EMA and then retraces back to the 50 EMA making a new high at 0.85148
- We now project our targets. BE Target = High – Low (85148 – 0.84088 = 0.0106). So BE target would be Low (or entry) – distance (0.0106), which is 0.84088 – 0.0106 = 0.83028. We now calculate the final target which is 0.0106 x 1.5 = 0.0159. Projecting this from the possible entry of 0.84088, the final target we get is 0.82498
- Price then drops below the previous low and declines further to make a new low.
- We now place a sell order at the previous low of 0.84088, with break even target of 0.8028 and the final target at 0.82498
- Stops are placed at the visible high at 0.84652
- Overall, this trade has a 1:2.8 RR
Buy Criteria
- Price must be trading at or above the 50 EMA
- Price must make a high and then retrace back to make a low but stay above the 50 or 200 EMA
- Using the horizontal line tool, mark the high point before the retracement low
- Once price breaks the high, wait for a new high to be made and price starts to retrace back to the previous high
- Place a buy order at the previous high with stops at the most visible low
- Measure the distance of the high to low and project the distance 1.5 times from entry
The chart below illustrates how the buy trade set up is identified.
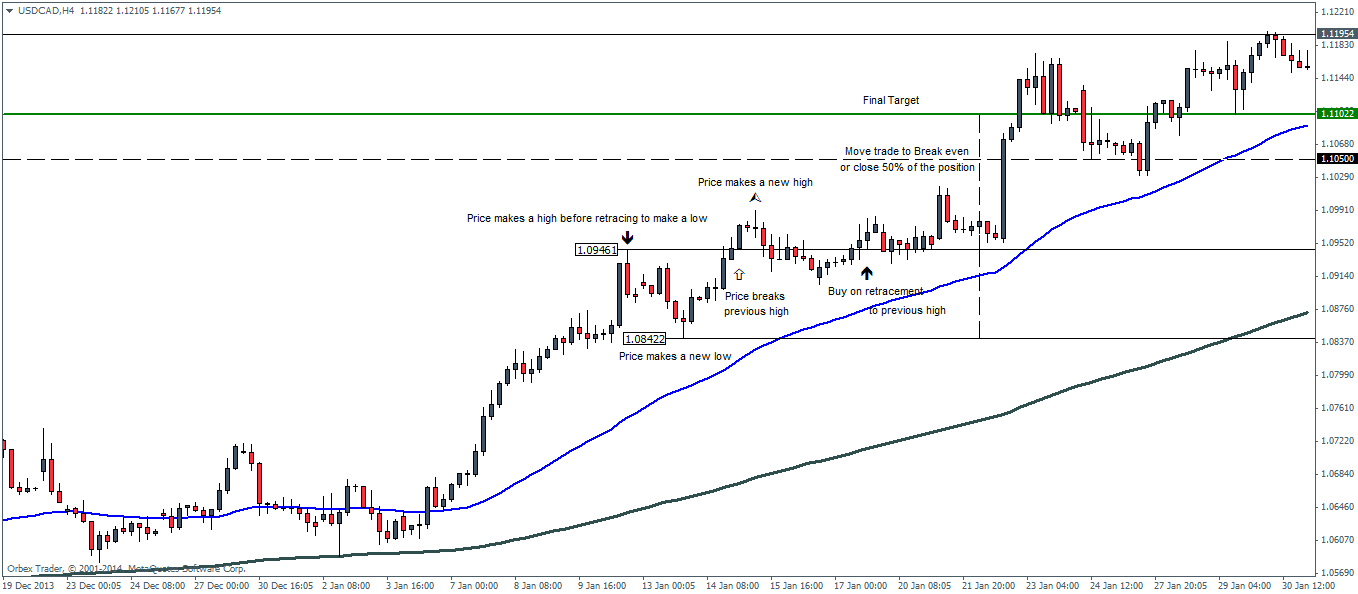
- In the above chart, price makes a high at 1.09461, above the 50 and 200 EMA and then drops to make a new low at 1.08422
- Price then rallies breaking above the previous high to make a new high and retraces back towards the previous high, which marks the buy order entry.
- Stops are placed at the previous low as it is the only visible stop level that we can see.
- From entry, the projected target is 1.5 times the distance of entry to the low (which is also where the stops are placed).
- When price travels the same distance as the entry to the low price, the trade is moved to break even or closed partially, with the final target in place
The advantage of using this trading strategy can be summarized into the following:
- Using the two moving averages and entering after the trend is established offers a low risk trading strategy
- The in-built risk management means that all the trades come with a minimum of 1:2 risk/reward trading strategy
- Because the strategy is based off H4 chart interval, the average holding period for the trades can be between a few days to a week at the most
- The trading strategy is very objective but requires a bit of practice to identify the trade set ups
The disadvantage of using this trading strategy includes:
- Trade set ups do not occur that frequently, so traders looking for make quick trades will find this as a disadvantage
- Sometimes, despite all the criteria being met, price does not retrace and continues to rally, which could result in a missed opportunity. Impulsive traders will find such scenarios very tempting to jump into the trade, ignoring the rules

