
Bollinger Bands® is an indicator that is widely used for measuring volatility. It was developed by John Bollinger in the 1980’s, a long time market technician and well respected in the industry. Bollinger Bands® are based upon a moving average, with upper and lower bands that expand and contract as volatility changes. The upper and lower bands are calculated based on a standard deviation of the moving average. The default settings for Bollinger Bands® are 2 standard deviations for a 20 period moving average, commonly referred to as 20, 2 settings. The chart below shows the Bollinger Bands, applied to a daily chart with the default settings.
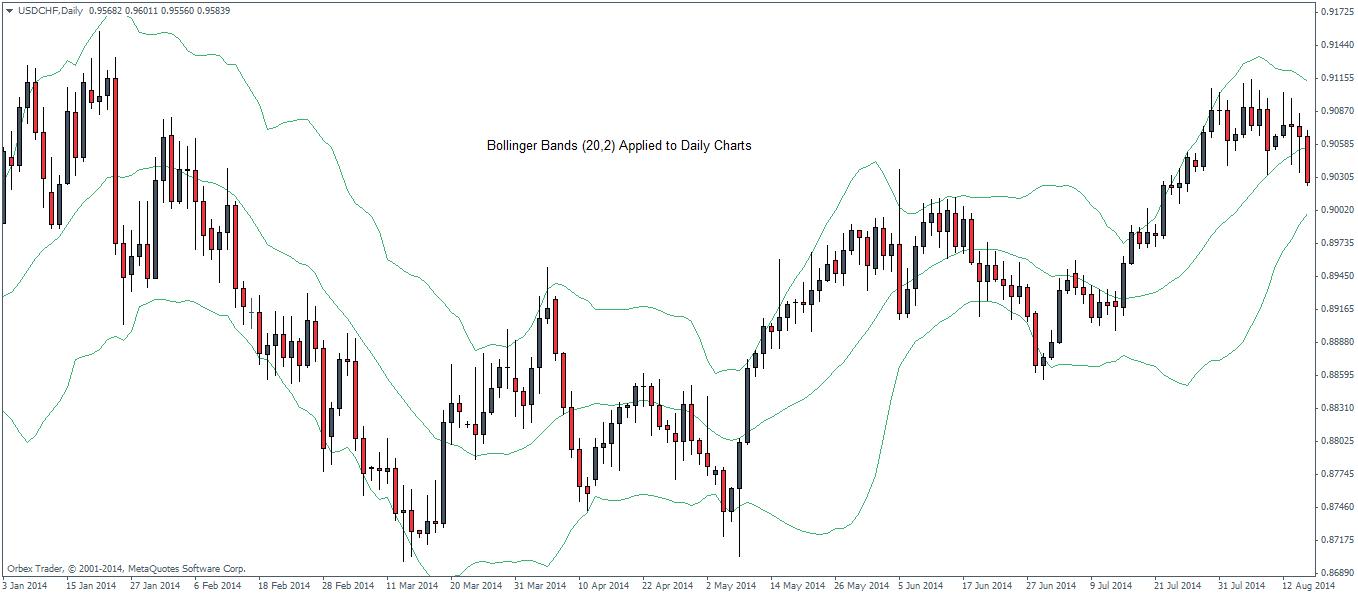
Understanding how Bollinger Bands® work
Bollinger Bands comprise of three bands. The main point of reference is the 20 period moving average (simple) with the upper and lower bands separated by 2 standard deviations.

Standard deviation measures the amount of variation (or dispersion) from the average. Bollinger Bands is based on the concept of reversion to the mean, which states that the highs and lows in a price are only temporary and that the price eventually tends to come back to its mean. From the context of Bollinger Bands, this means that when prices tend to be at extreme highs and lows, trading at either ends of the bands, prices sooner or later revert back to the 20 period moving average. It is perhaps based on this concept that there is a widely circulated theory of buying or selling when price is at one of the extremes of the band. The problem, as can be seen is that when a trend is strong, there is no stopping and prices can continue in that trend.
Bollinger Bands are constructed as follows:
- Middle Band = 20 Period Simple Moving Average
- Upper Band = 20 Period Simple Moving Average + (20 Period Standard Deviation of Price x 2)
- Lower Band = 20 Period Simple Moving Average – (20 Period Standard Deviation of Price x2)
What is the benefit of using Bollinger Bands?
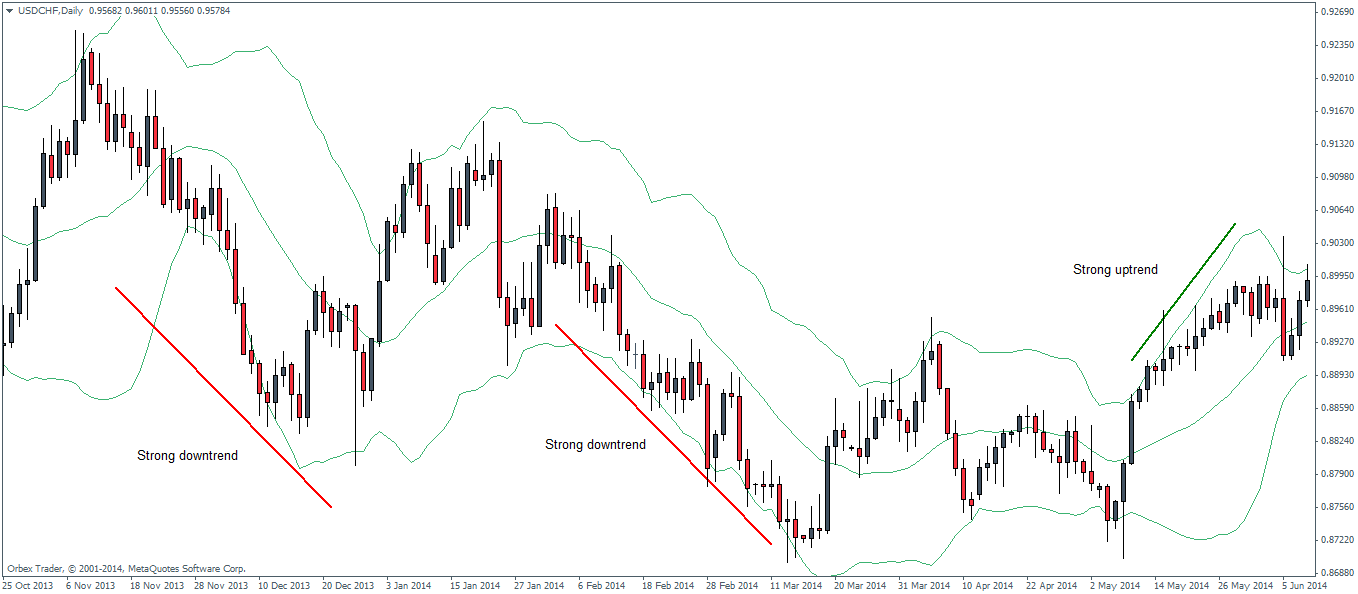
Bollinger Bands are primarily used for gauging trends in the short term. The most common application is to look for over-bought and over-sold market conditions, when prices start hugging the upper or lower bands. A reversal is most commonly expected when price starts to move near the either of the bands. However, in cases of strong trends, price tends to hug one of the bands and continue in that same direction. Therefore, traders need to be careful and should not blindly sell when price is at the upper Bollinger Band or buy when price is near the lower Bollinger Band.
The chart below, (Figure 2) shows that when a trend is strong, prices continue to trade near the upper or lower bands for an extended period of time. This proves that the previously mentioned concept of buying or selling at one of the upper or lower bands can sometimes result in entering a position on the wrong side of the trend.
Bollinger Bands – When you Buy or Sell at the Extremes?
The simplest way to use Bollinger Bands, by selling at the upper band and buying at the lower band is when volatility is low, represented by contracted bands which are nothing but price moving within a range or in consolidation. This is phase occurs frequently and is usually followed by the bands expanding, indicating volatility.
The following chart (Figure 3) shows how prices behave when the bands contract and the start of a trend when the bands start to expand.
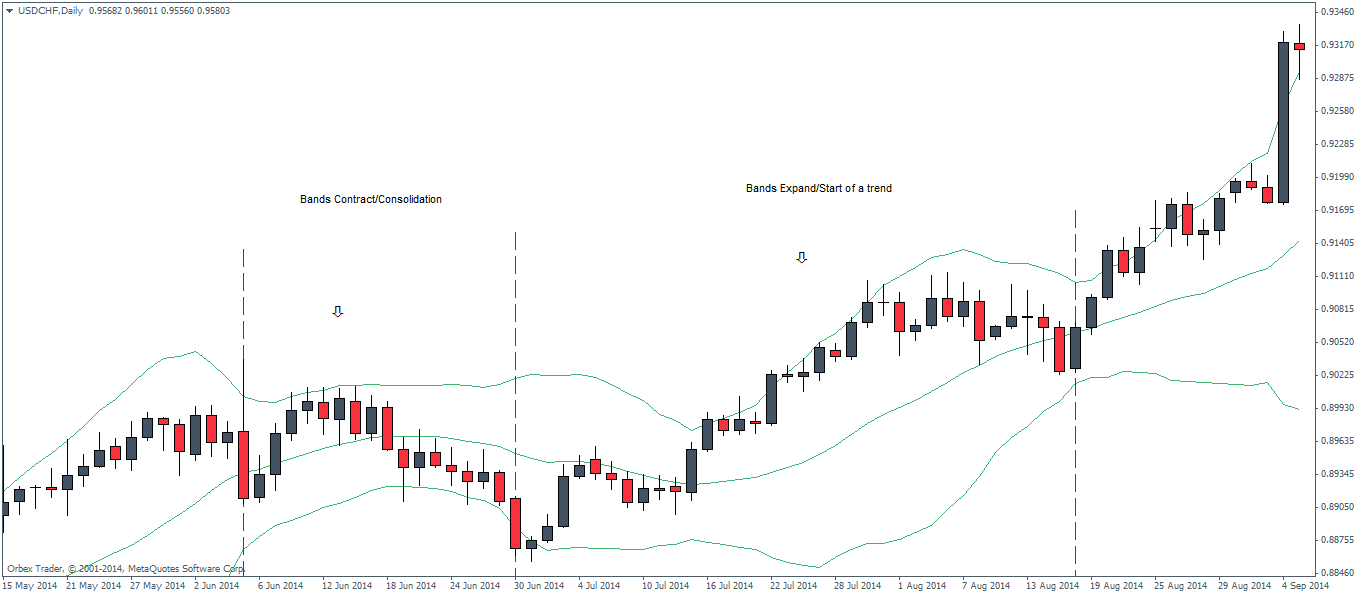
From the above chart, we can make the following observations:
- When the bands start to contract, it exhibits a period of low volatility or ranging (consolidating) price action
- When the bands expand, it exhibits a period of a strong trend that emerges as volatility expands, represented by the expansion in the bands
Therefore, we can now apply the following rules when trading with Bollinger Bands.
- When the bands are contracted, the likelihood of selling at the upper band, targeting the 20 period moving average or buying at the lower band, targeting the 20 period moving average offers a good and reliable trading strategy
- When the bands are expanding, there is a strong likelihood for a new trend to start depending on where price is in relation to one of the bands
The chart below (Figure 4) shows an example of how to trade with Bollinger Bands. In the first part of the chart, we notice the bands contracting after a period of expansion. This tells us beforehand that prices are likely to move within a tight range. So we look to buying when price hits the lower band and exit at the 20 period MA.
Following the period of contraction, we start to notice the bands expanding, indicating a new trend emerging and therefore, we again buy when price hits the lower band and this time hold on until the new trend is established. We then exit when price drops back to the 20 period MA after trading near the upper band.
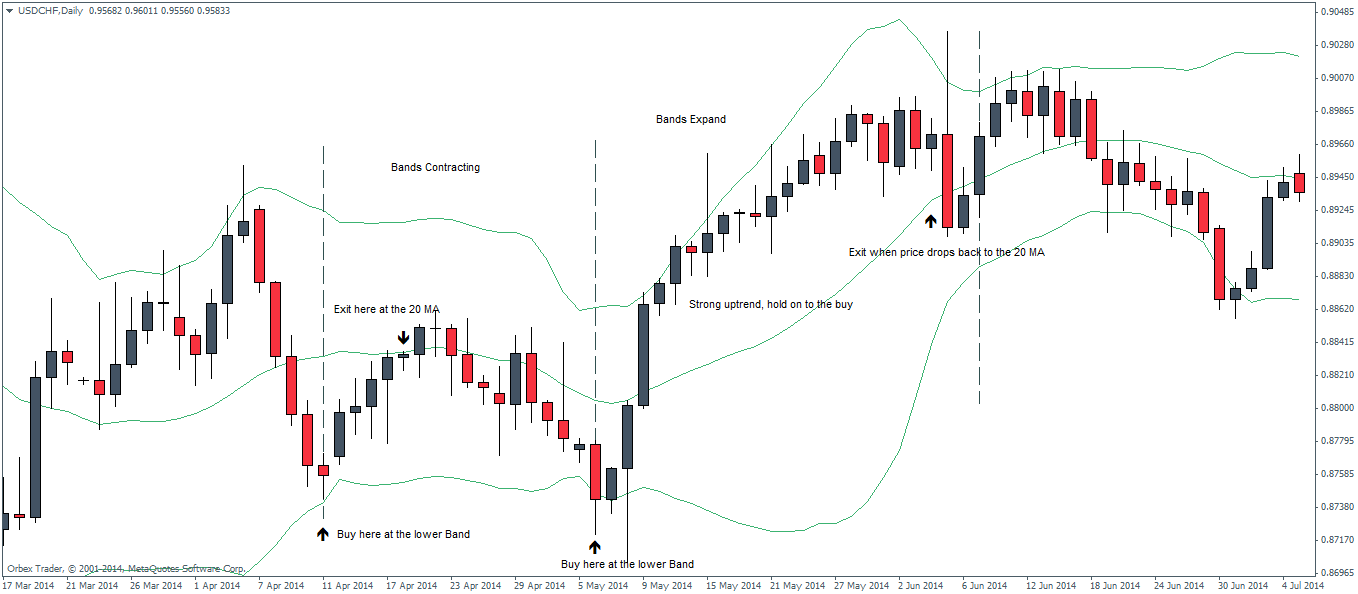
As we can see with both the above examples, the Bollinger Bands can make for a versatile trading indicator which can visually represent the market volatility and therefore signal us to new trends that emerge in the short term. When the bands are combined with other techniques such as candlestick price action, the trading can be vastly improved.

![Credit Card 160×600 [EN]](https://assets.iorbex.com/blog/wp-content/uploads/2023/06/13144507/Blog-Banner_EN-Banner_160X600X2.webp)