
Introduction to Types of Flag Patterns and How to Draw Flags Correctly
In the previous Tutorial , we discussed the benefits of combining technical and fundamental analysis for short term trading by using the flag chart patterns. In this tutorial, we’ll delve a bit deeper into identifying the different type of flag patterns that are formed as well as provide insights into how to draw flag chart patterns correctly so that traders are better able to pick out the entry as well as set stop losses and take profit levels more accurately.
Types of Flag Patterns Trading
At the very outset, flag patterns are either bullish flags or bearish flags. However, the validity of the flag patterns vary depending on the duration or the amount of time it takes for the pattern to be formed. If one can scan a chart through any time frame, it is not difficult to notice the different variations of the flag patterns. Some of the flags are formed within a few price bars and this type is often seen ahead or after a news release, while the second type of flag patterns are formed over a prolonged period of time.

In the context of this article, we will therefore identify flag patterns as short term and long term.
The chart below gives an example of a short term and a long term flag patterns. The main differentiating factors between the long term and short patterns can be summarized as follows:
| Short Term Flag Patterns | Long Term Flag Patterns |
| Formed very quickly within a few price bars | Formed over a period of time |
| Quick retest of the break out price | Slow or multiple retests of the break out price |
| Objective is reached very quickly | Price tends to gradually drift towards the price objective |
| More credible in terms of reaching the target price | Not very credible as price can often reverse mid way |
| Tight stop losses could result in price taking out stops before moving in the intended direction | Stop losses are relatively further away from entry |
| The lower end (of a bearish flag) or the upper end (of a bullish flag) often gives way to price | The lower end (of a bearish flag) or the upper end (of a bullish flag) often acts as support or resistance levels |
| Forms mostly around an important news release | Forms over a period of time depending on the time frame in consideration |
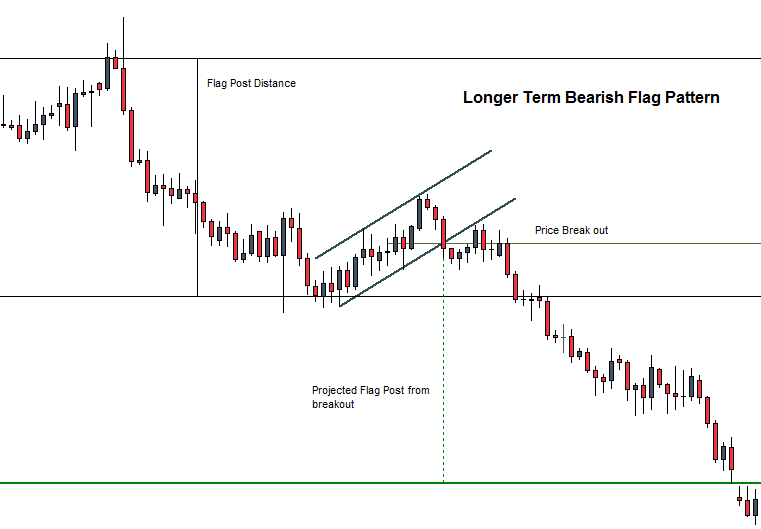
The above example of a long term flag pattern is that of the EURUSD daily charts. It takes almost 41 trading days for the bearish flag to be completed followed by a break out and finally price reaching the objective.

The second example above shows a short term flag pattern formed within a very small span of time.
How to draw flag patterns correctly
While at first, traders might find it to be a bit subjective, when the patterns are taken into context within the larger trend and the surrounding fundamentals, it isn’t hard to spot and draw a flag pattern correctly. The following criteria should help beginners to identify potential flag patterns.
- Look for strong bars (bullish or bearish) that are formed in quick succession
- Look for smaller price candles being formed right after these strong bars
- Visually identify if the consolidation is showing a small counter trend move
- An easy way to spot for strong bars is to switch to H1 or H4 charts ahead of an important news release
- Sometimes the flag portion of the flag patterns can be confused for a pennant or a small ascending or descending triangle. When in doubt leave these patterns along and look for more visually agreeable flag patterns
Having learnt the type of flag patterns and also some basic idea into how to draw the flag patterns, in the next article, we’ll take a look at the various elements of the flag patterns, more importantly the support/resistance levels that are formed and how to trade the break outs from these flag patterns with more reliability.

![Credit Card 160×600 [EN]](https://assets.iorbex.com/blog/wp-content/uploads/2023/06/13144507/Blog-Banner_EN-Banner_160X600X2.webp)