
With Saudi Arabia slashing prices while keeping production steady, the rumor mills are now strongly divided on the cause of declines. One school of thought validates the move by Saudi Arabia as an effort to keep its market share, especially in the US which has seen a growth in domestic crude production thanks to the shale drilling efforts. On the other hand, critics are seeing this move as being politically motivated. Being one of the strongest allies of the US in the middle-east, the move by Saudi Arabia is being seen as a pressure tactic to reign in Russia and Iran. Russia, which is already hit by sanctions, is now starting to feel the pinch as its recent government budget was accounted for a $100 pricing in crude oil. With prices now trading below $80 supported by a stronger Greenback against the Ruble, Saudi Arabia’s decision on its crude oil pricing and production is being closely watched.
Although the declines in Crude Oil might not be good news for Russia and other countries such as Iran, the declines are a welcome change for most of the global economies. According to the IMF, a $10 decline in crude pricing gives a boost to approximately 0.3% of the global GDP. This is especially welcome in the Eurozone where growth has been mostly stagnant, however at the cost of increasing the crisis in Russia as well as affecting other currencies closely related to Oil such as the Canadian dollar and the Norwegian Krone.
OPEC will be meeting towards end of November and investors will be closely watching the event, although the OPEC chief Abdallah Salem Al-Badri has maintained that OPEC will stick to its current production levels while expecting crude oil prices to return to normalcy.
Crude Oil Technical Analysis

Our preferred monthly crude Oil chart shows the major support level at 78.70 being broken. However, the point to note here is that it would be a valid break only if we see a monthly close below this level. With more than two weeks left, there is still a lot of scope for Crude oil, especially on the monthly charts to reverse and even possibly close above 78.7 handle.
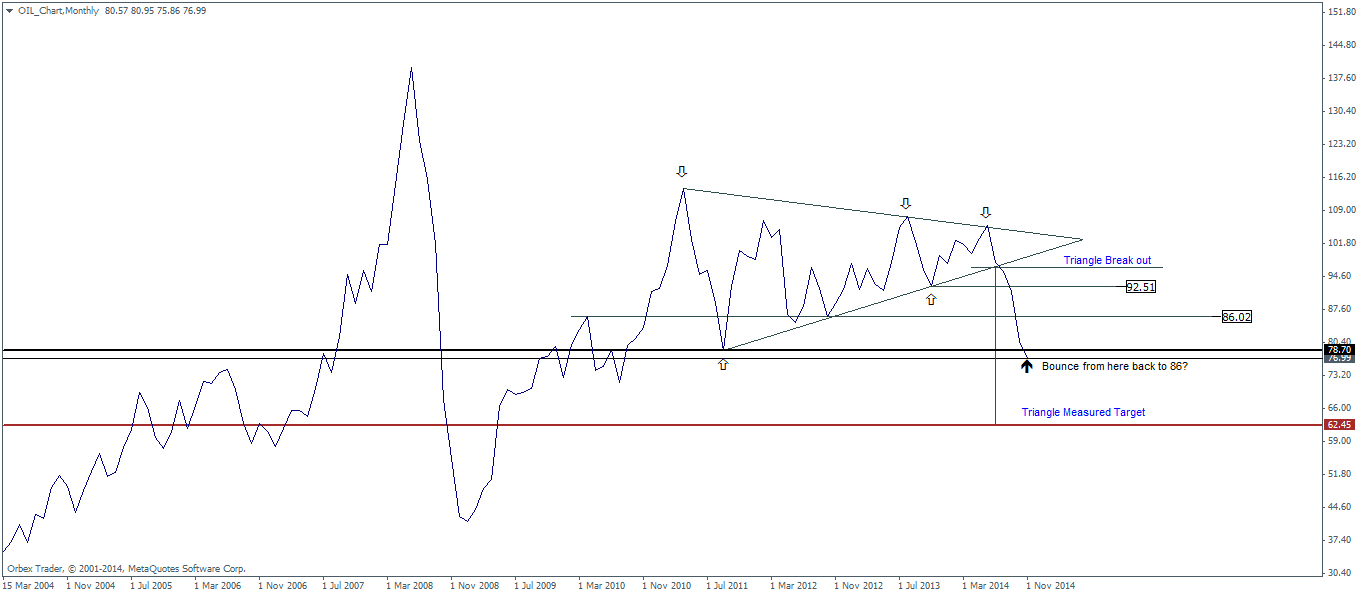
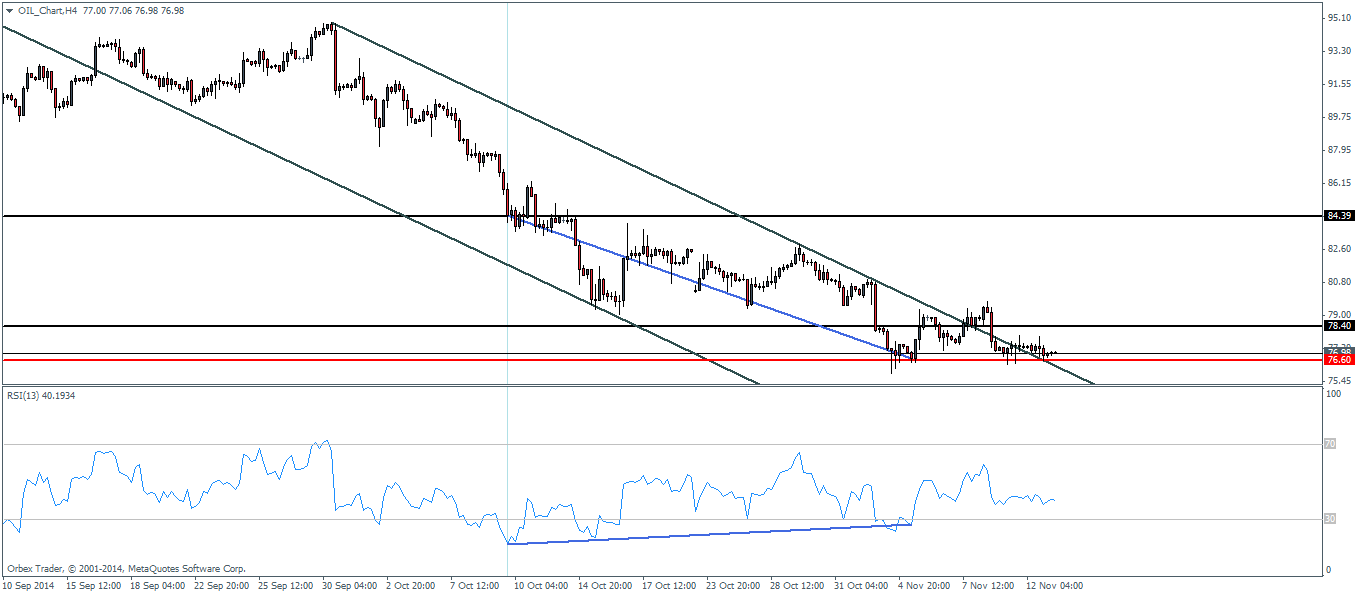
The main hurdle for Crude oil, on the H4 charts comes in at the 76.5 handle. We notice a clear divergence to the RSI being formed, pointing to a potential rally towards 84.39 handle. When looking at this from the monthly perspective, we can see that the previous support that was broken at 86 wasn’t quite tested for resistance. Combining the two, we could therefore look at an alternative scenario where a failure to close below 78.7 handle from the monthly charts could paint a bullish picture for Crude Oil at least for the short term.
When looking to the H1 charts, we can notice an alternate price channel being formed, while Crude oil seems to have formed a base near support of 76.7 handle, which validates the view from the H4 charts. The immediate resistance comes in at 78.2 and 78.4 handle, which should potentially hold any rallies in Crude oil for the short term.
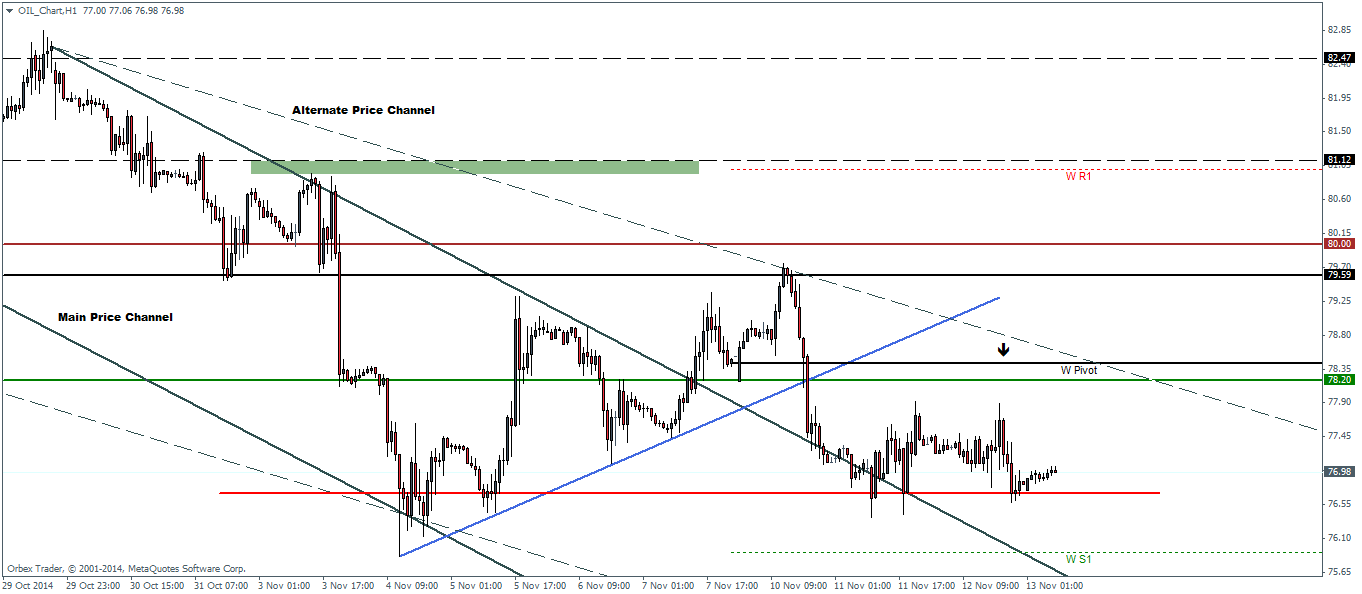
To conclude, a break below 76.7 is essential to see more declines in Crude Oil validated by a monthly close below 78.7. Failure to break below 76.7 could trigger a minor rally back to 78.2 – 78.4 levels while the monthly charts could see a test of broken support near 86.02 being tested for resistance.
Crude Oil Pivot Levels
| R3 | R2 | R1 | Pivot | S1 | S2 | S3 | |
| Weekly | 86.09 | 83.52 | 81 | 78.43 | 75.91 | 73.34 | 70.82 |
| Daily | 78.95 | 78.42 | 77.64 | 77.11 | 76.33 | 75.8 | 75.02 |

