
Divergence-based trading strategies are quite common and often used in tandem with trend following strategies. Perhaps one of the most commonly used technical indicator that comes to mind when using the concept of divergence in forex is the MACD, also known as the moving average convergence divergence. There are many other indicators that can be used as well securities for a relative comparison.
Trading with divergence offers traders many benefits, some of them are:
- Timing the dips and rallies in an uptrend and a downtrend respectively
- Divergences can be used to spot support and resistance levels with a greater accuracy
- Trading strategies can be developed using divergences, to build a long term as well as scalping opportunities
- An essential element that determines your success in divergence is in understanding the indicator or the security being used to spot the divergence set ups
- Trading with divergence can be applied to any market and any time frame
Here are some examples of divergence setups.

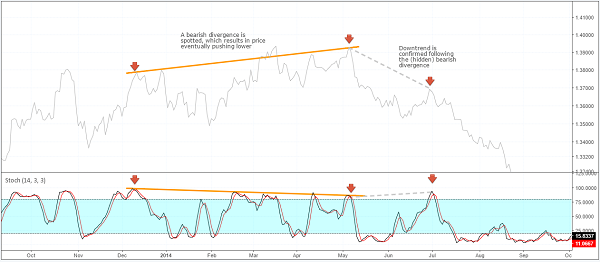
In this first article, we take a look at the background of divergence trading and understanding what causes divergence in the first place and what does it say about the markets. It is important to understand the basics of divergence before delving further into the fascinating world of divergence based trading.
Divergence based trading can be applied in a number of ways, from timing entries into a trend or as short term scalping strategies as well
Understanding divergence in the markets
Divergence is a synonym for the difference, dissimilarity or separation. Divergence was conceptualized by Charles Dow in his famous ‘Dow Theory.’ Speaking on divergence, he said, “Stock market averages must confirm each other” (not to be confused with moving averages). When Dow referred to stock market averages, he was referring to the stock indexes, namely the industrial average and railroad average. According to Dow, there was a strong relationship between the industrial and the railroad averages.
The concept of divergence was put forth by Charles Dow in his famous ‘Dow Theory’
If manufacturer’s profits were rising, it means that they are producing more goods, which translates to increasing shipping or transportation of the goods to the consumers, and thus a rising industrial average leads to a rising railroad or a transportation average.
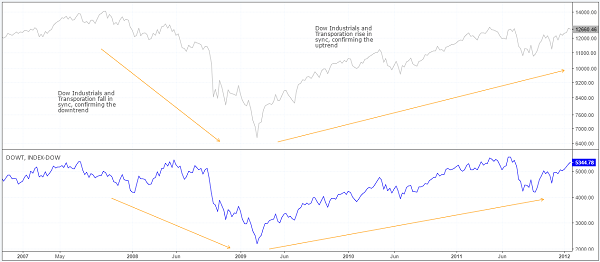
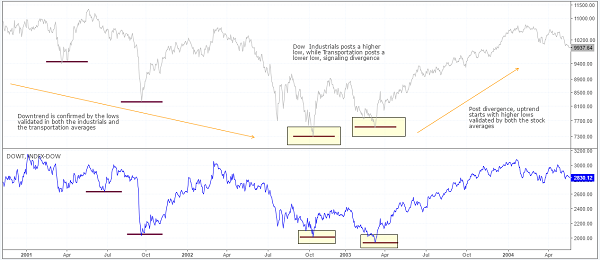
Therefore, in an uptrend, a rising industrial average is confirmed by a rising transportation average and in a downtrend, both the stock market averages tend to fall. Dow said that when one of the two averages fails to confirm one another, it was a warning sign that change was in the air.
When two securities or an indicator fails to confirm the other, it signals a divergence and a potential change in the prevailing trends.
Charles Dow went to explain in detail why this (divergence) happens.
Imagine that the industrial goods index was falling but the transportation index started to rise. This signifies that production was slowing down while the transportation index was merely clearing up the stockpiles or the available inventory. Sooner or later, once the stockpiles are shipped, the transportation index would also start to fall.
Another example would be a rising industrial goods index, which signals increased production, but a falling transportation index which is falling, signaling slower movement of inventory. If the divergence continued, industrial goods production would have to be slowed down in order for the transportation sector to keep up with the backlog of inventory or stockpiles.
As one can understand by now, Dow’s take on divergence was merely to establish a relationship between two securities that are closely related to each other and to confirm trends as long as both the securities were moving in tandem. A disconnect between the two, known as divergence is what is understood to be a caution for traders, which something was amiss.
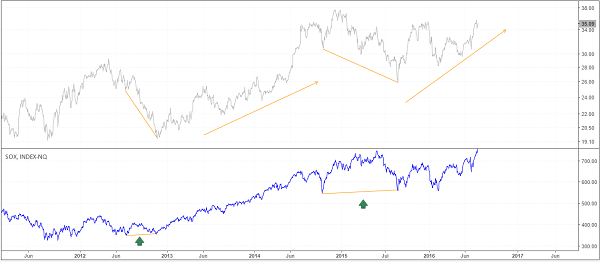
Divergences can be applied to any markets and securities. It works best when the securities being compared are dependent. For example, in Figure 4, a comparison between the Intel stock (INTC) and the Semiconductor sector (PHLX) shows two instances of divergences where the lows in price were not confirmed. Following the divergence, you can see how prices started to correct higher and embarked on a bullish rally after that.
Divergence Trading: Key takeaways
- Divergence occurs when there is a disconnect between two securities or a security and an indicator
- Trends are confirmed when both the securities, or the security and the indicator move in tandem, making lows and highs
- When divergence occurs, it signals a possible change in trend or a correction
- Divergence is a phenomenon that occurs and is a leading indicator
- With divergence, traders will be able to determine the trade entry as well as potential exit points in their trend setups
- Divergence-based trading is best suited for trend following strategies, but it can be equally used in short term scalping strategies as well
In the next article in this series, we will take a look at how divergence is applied in the forex markets and the four types of divergences that are widely used.

