
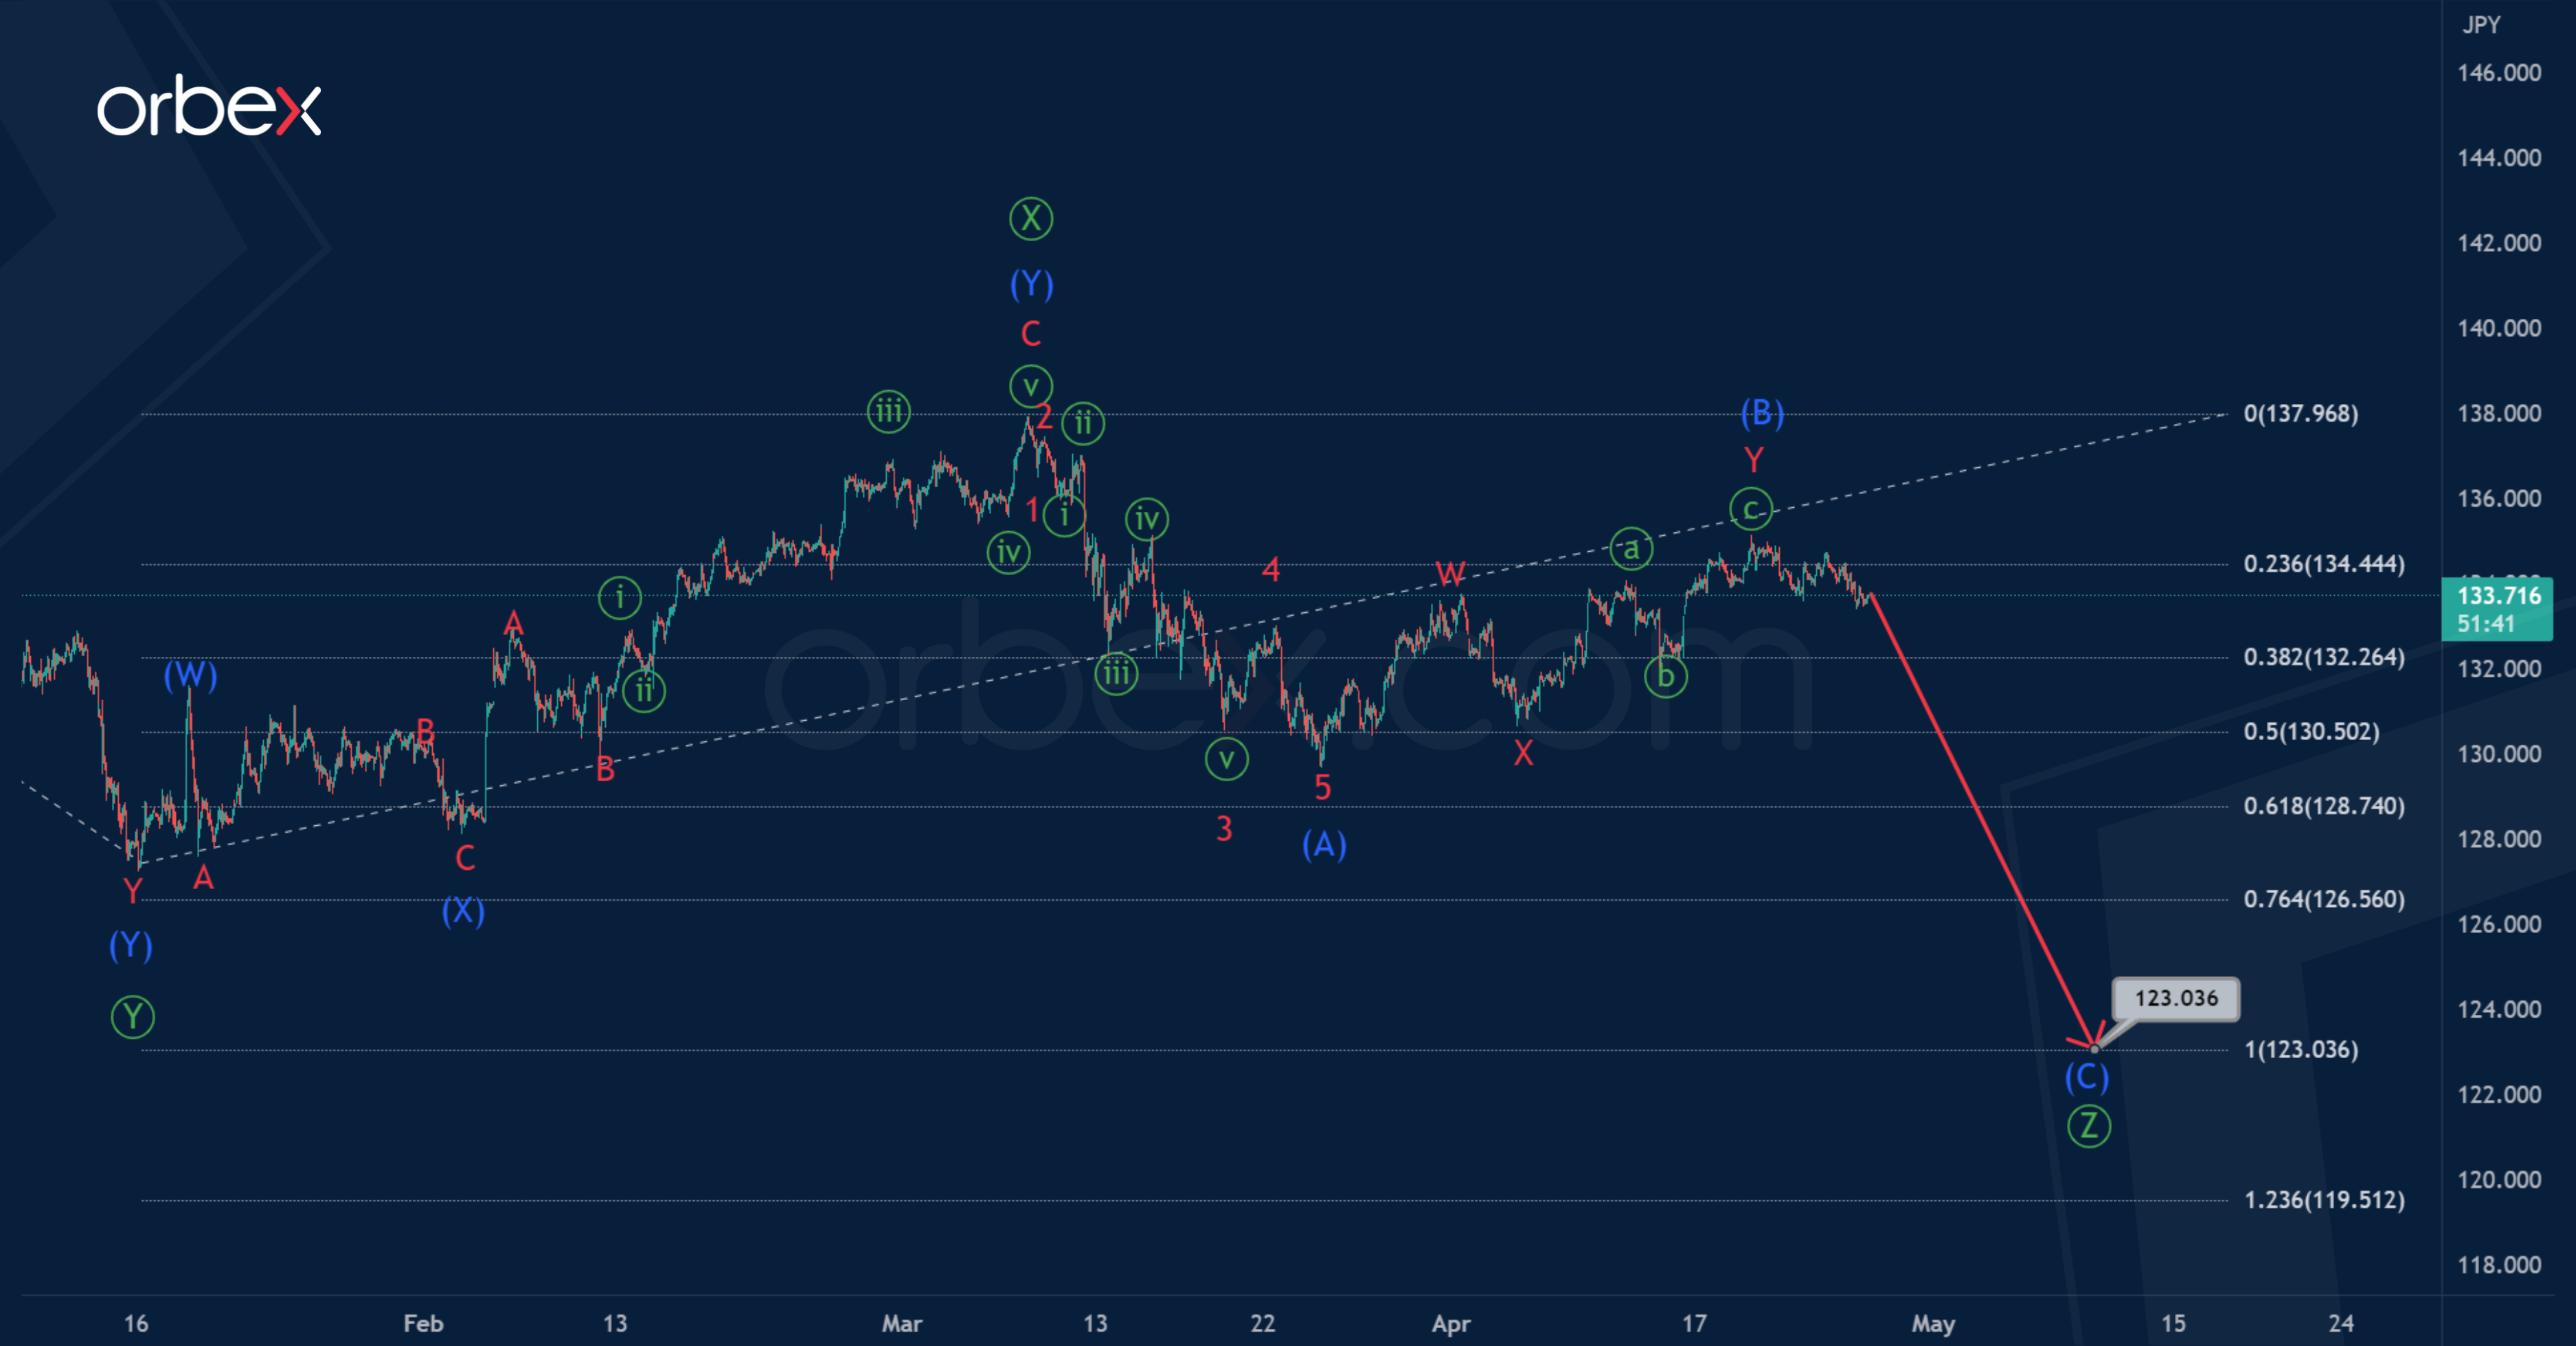
In the long term, the USDJPY pair could form a bearish trend. Most likely, the trend takes the form of a triple zigzag Ⓦ-Ⓧ-Ⓨ-Ⓧ-Ⓩ.
The final wave Ⓧ is a double zigzag consisting of intermediate sub-waves (W)-(X)-(Y).
At the time of writing, the market is in a wave Ⓩ. This wave, judging by its internal structure, takes the form of an intermediate zigzag (A)-(B)-(C). Since the correction (B) looks like a completed double zigzag, in the near future the pair could start moving in a bearish impulse wave (C) to 123.03.

At that level, primary waves Ⓩ and Ⓨ will be equal.
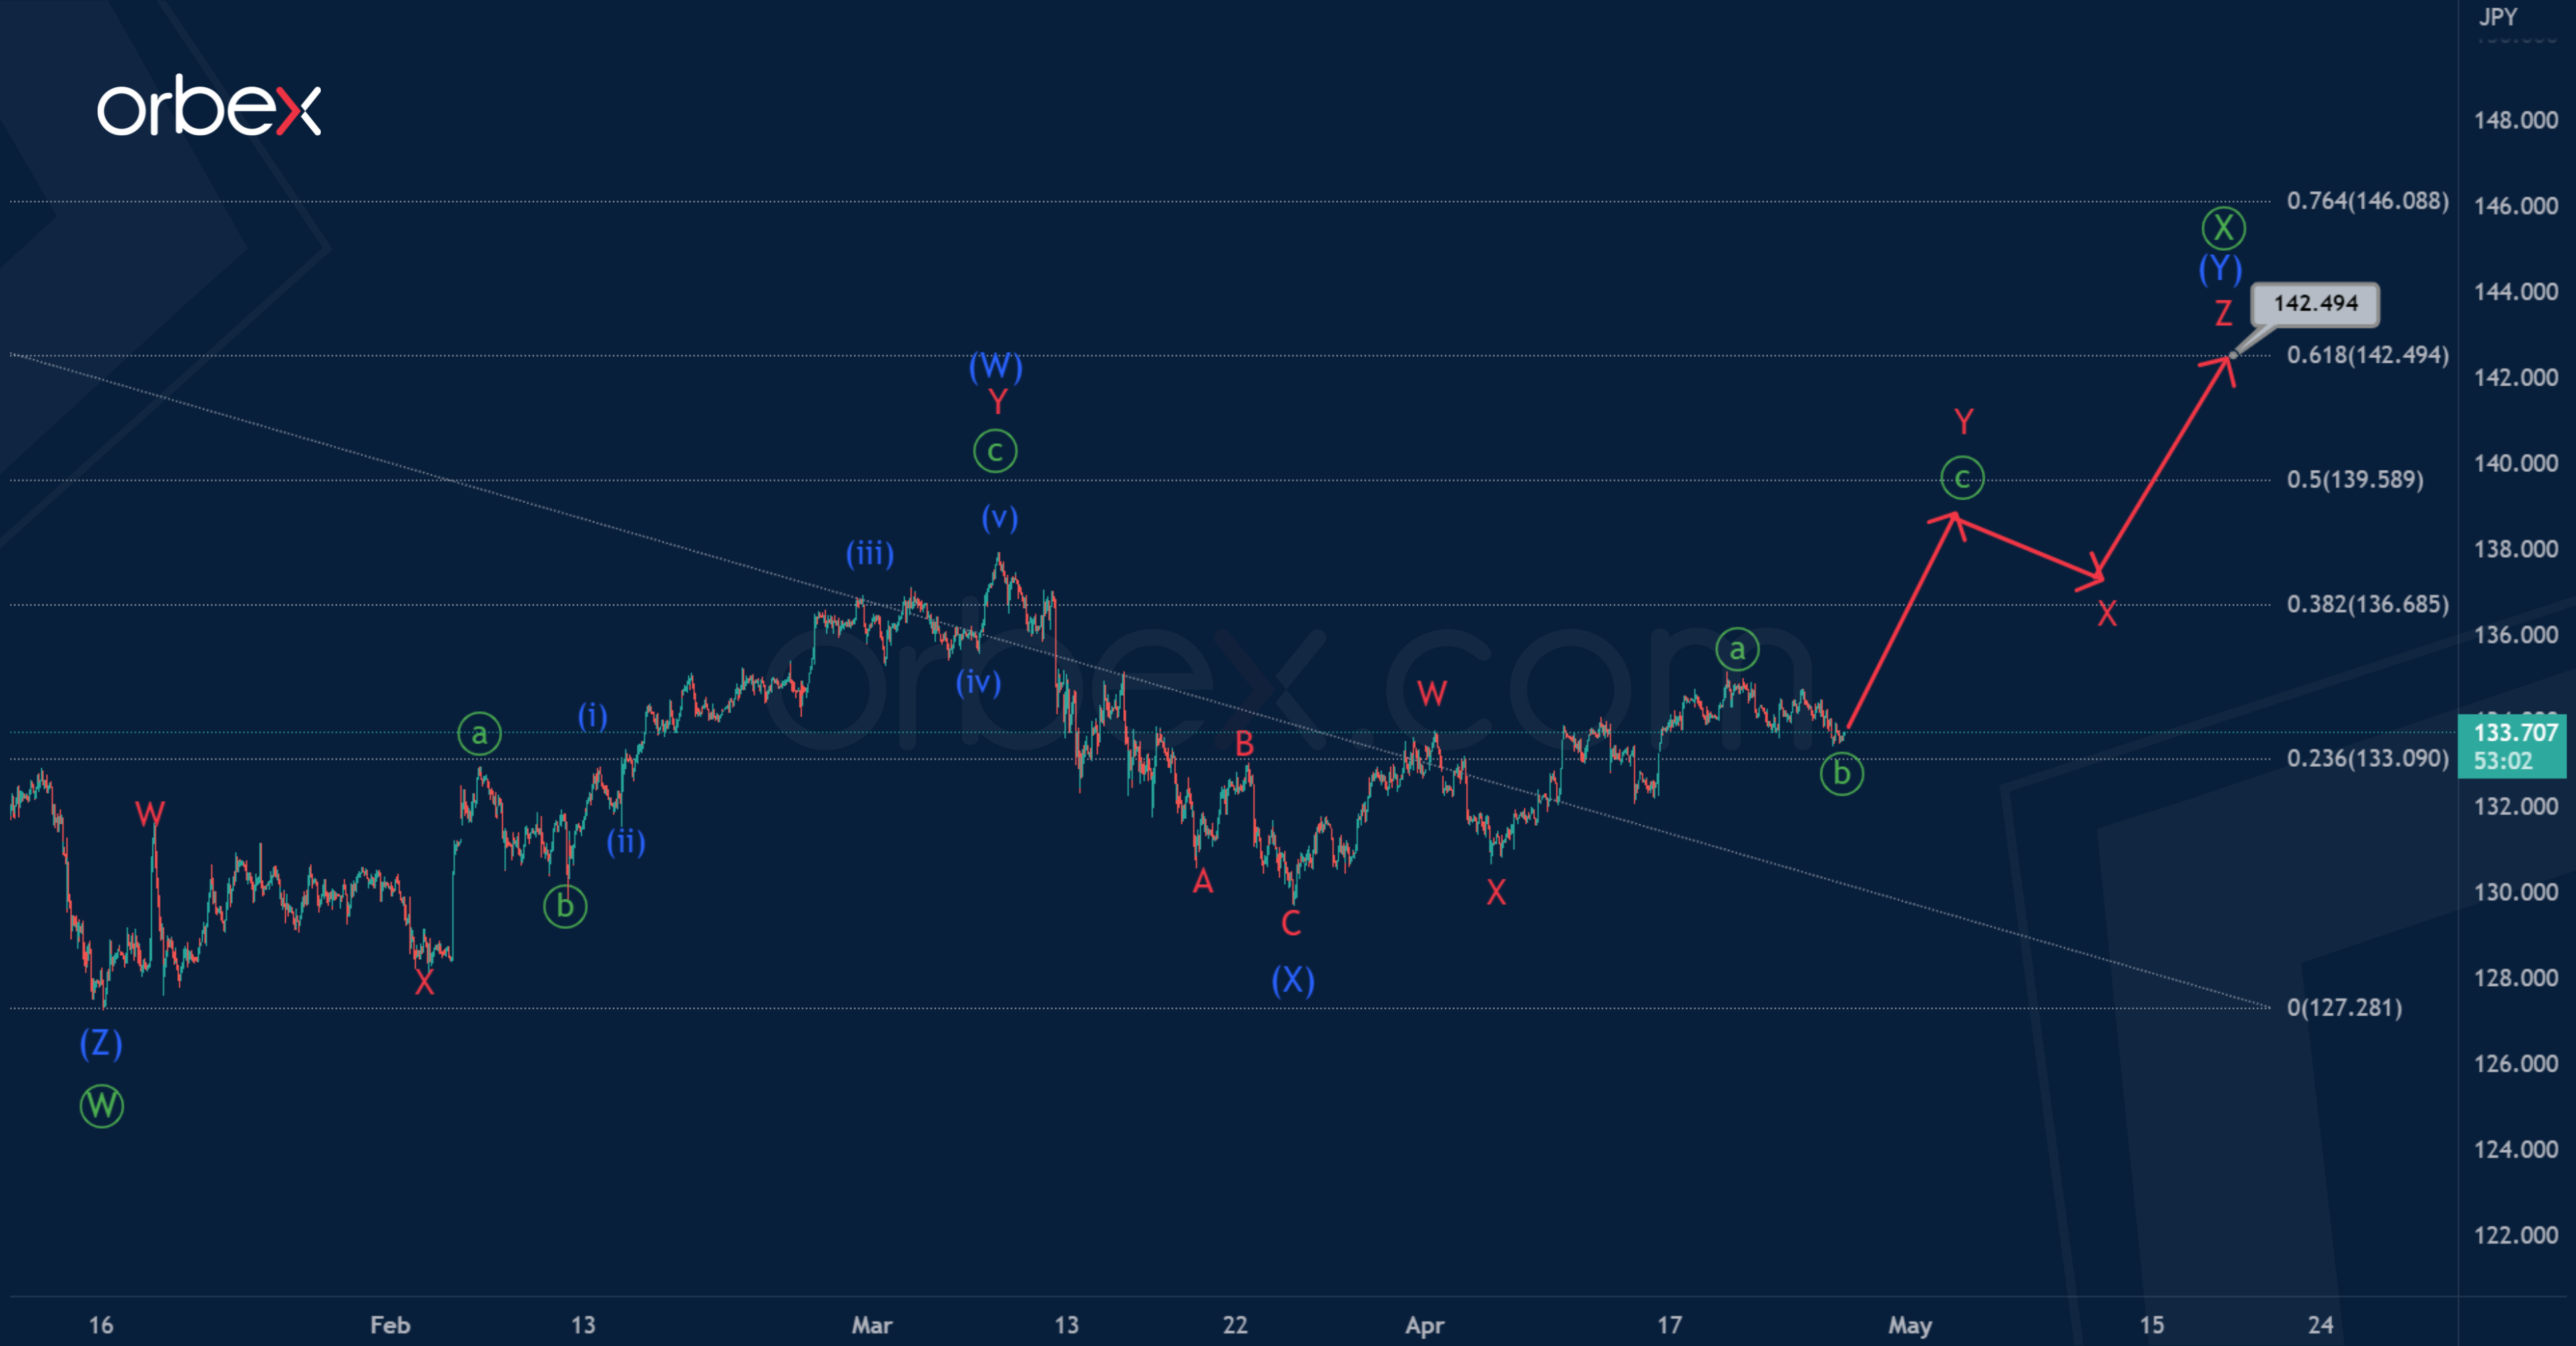
Unlike the main scenario, wave Ⓧ is under development.
The primary wave Ⓧ can take the form of a double zigzag (W)-(X)-(Y). Within this pattern, we see completed intermediate sub-waves (W) and (X).
Most likely, in the last section of the chart we see the beginning of the construction of the final actionary wave (Y), the initial structure of which hints at a triple zigzag W-X-Y-X-Z.
It is expected to end at 142.49, where the primary wave Ⓧ will be at 61.8% of wave Ⓦ.

