



USDCHF fighting back
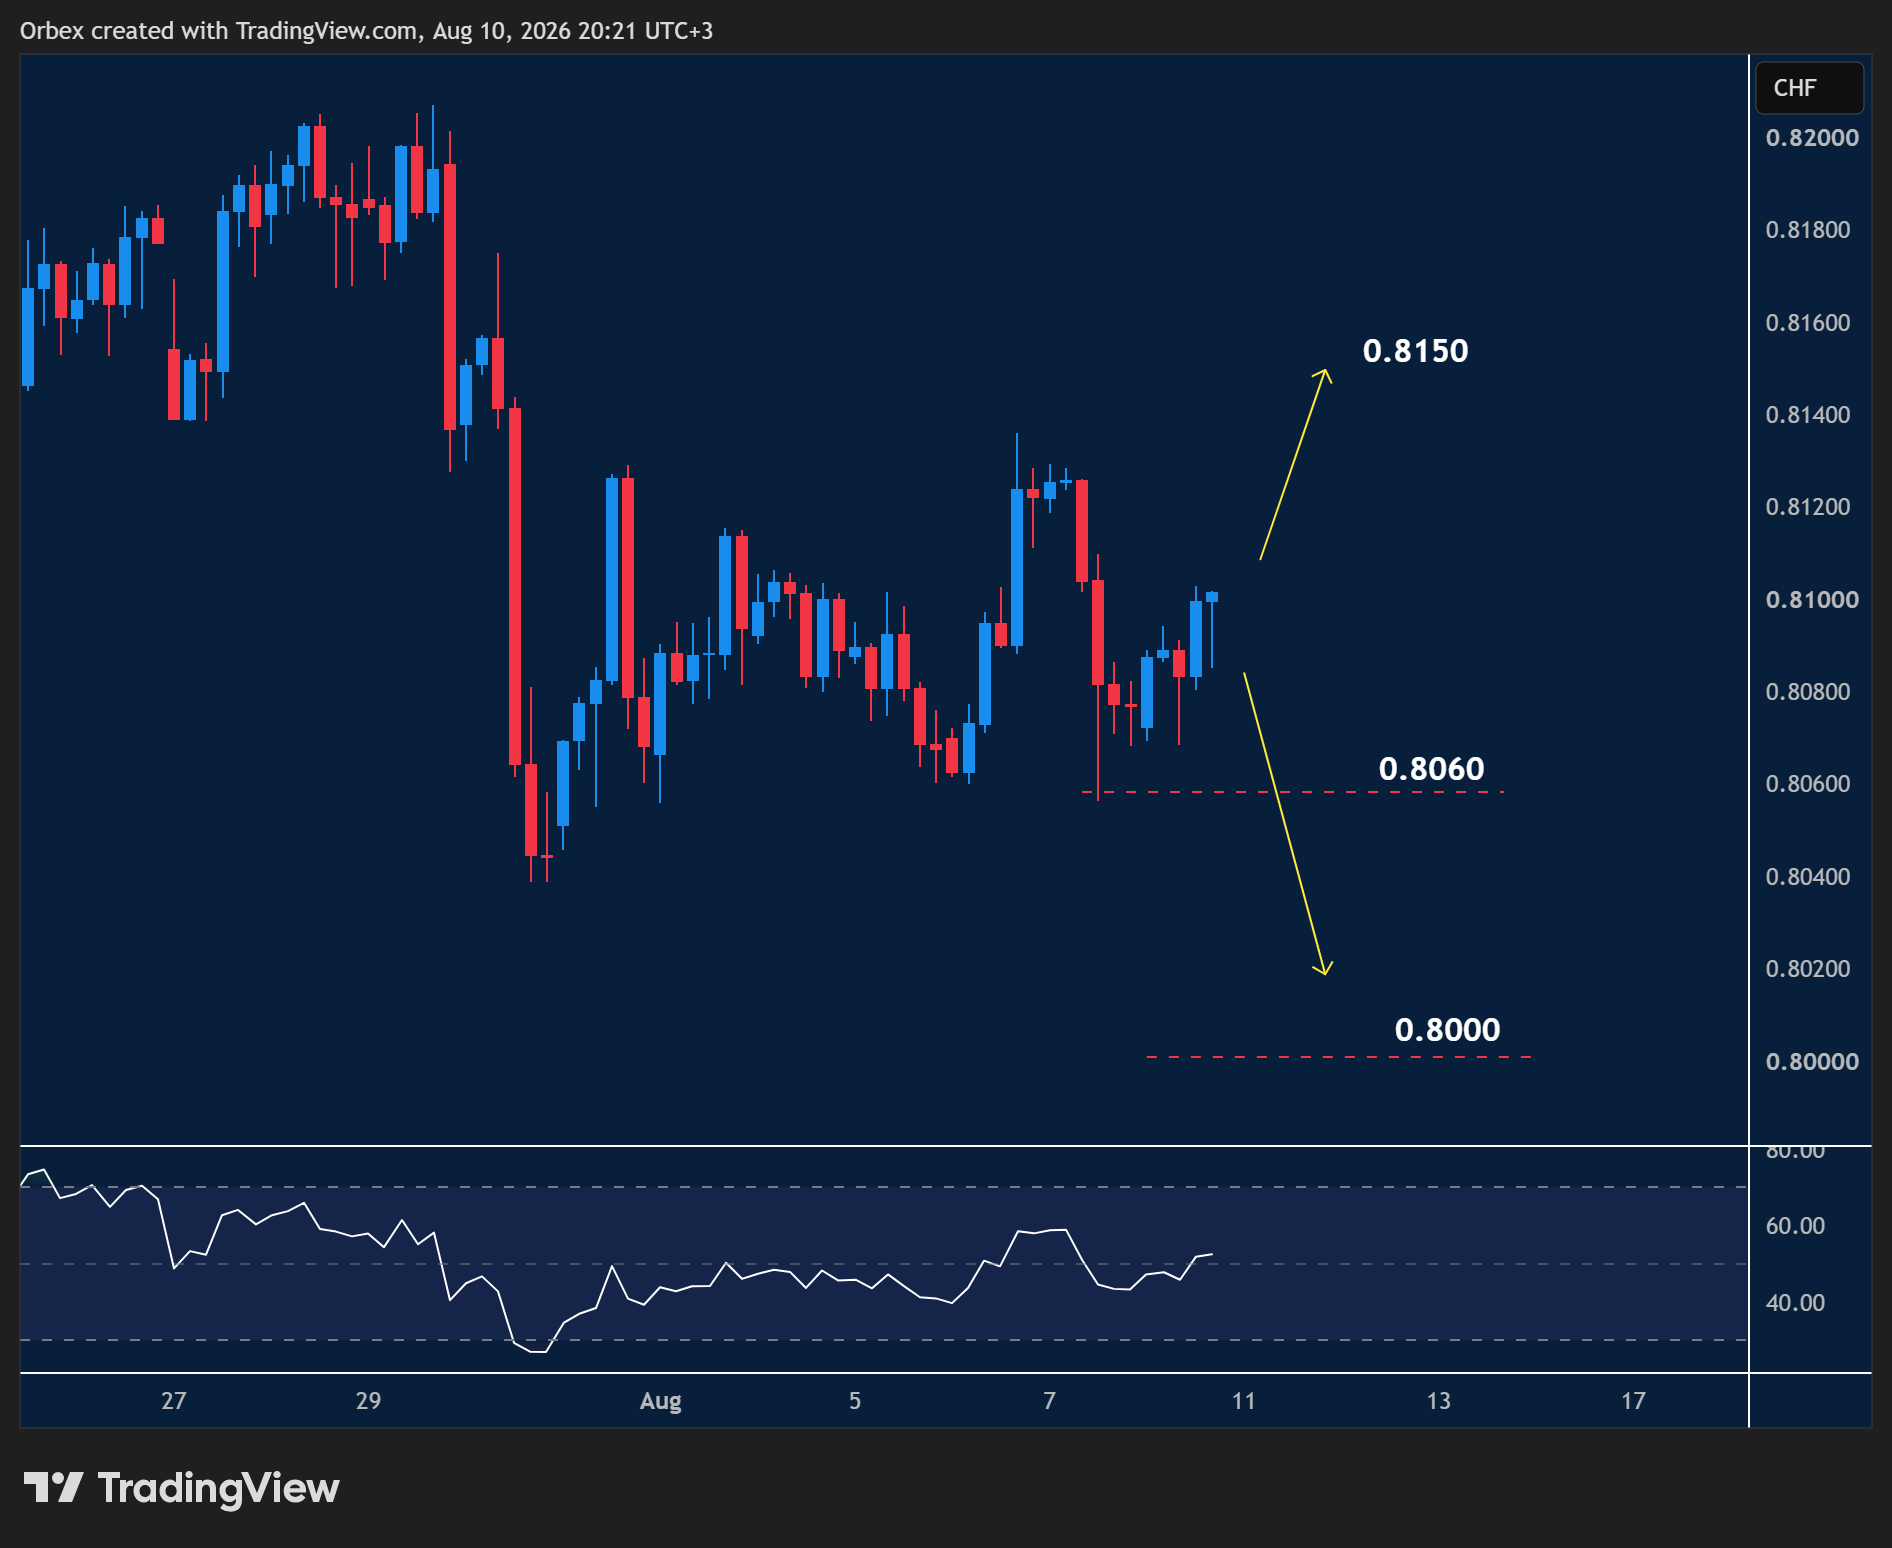
The US dollar hit another high point as prices test the 0.8100 level.
- The attempt at a full rebound would see a test at 0.8150.
- A failure to break higher would indicate that sellers have moved in to extend the recent bearish channel.
- A further breakout would force buyers to bail out, triggering a new round of selling to test the 0.8060 support.

EURGBP tests resistance
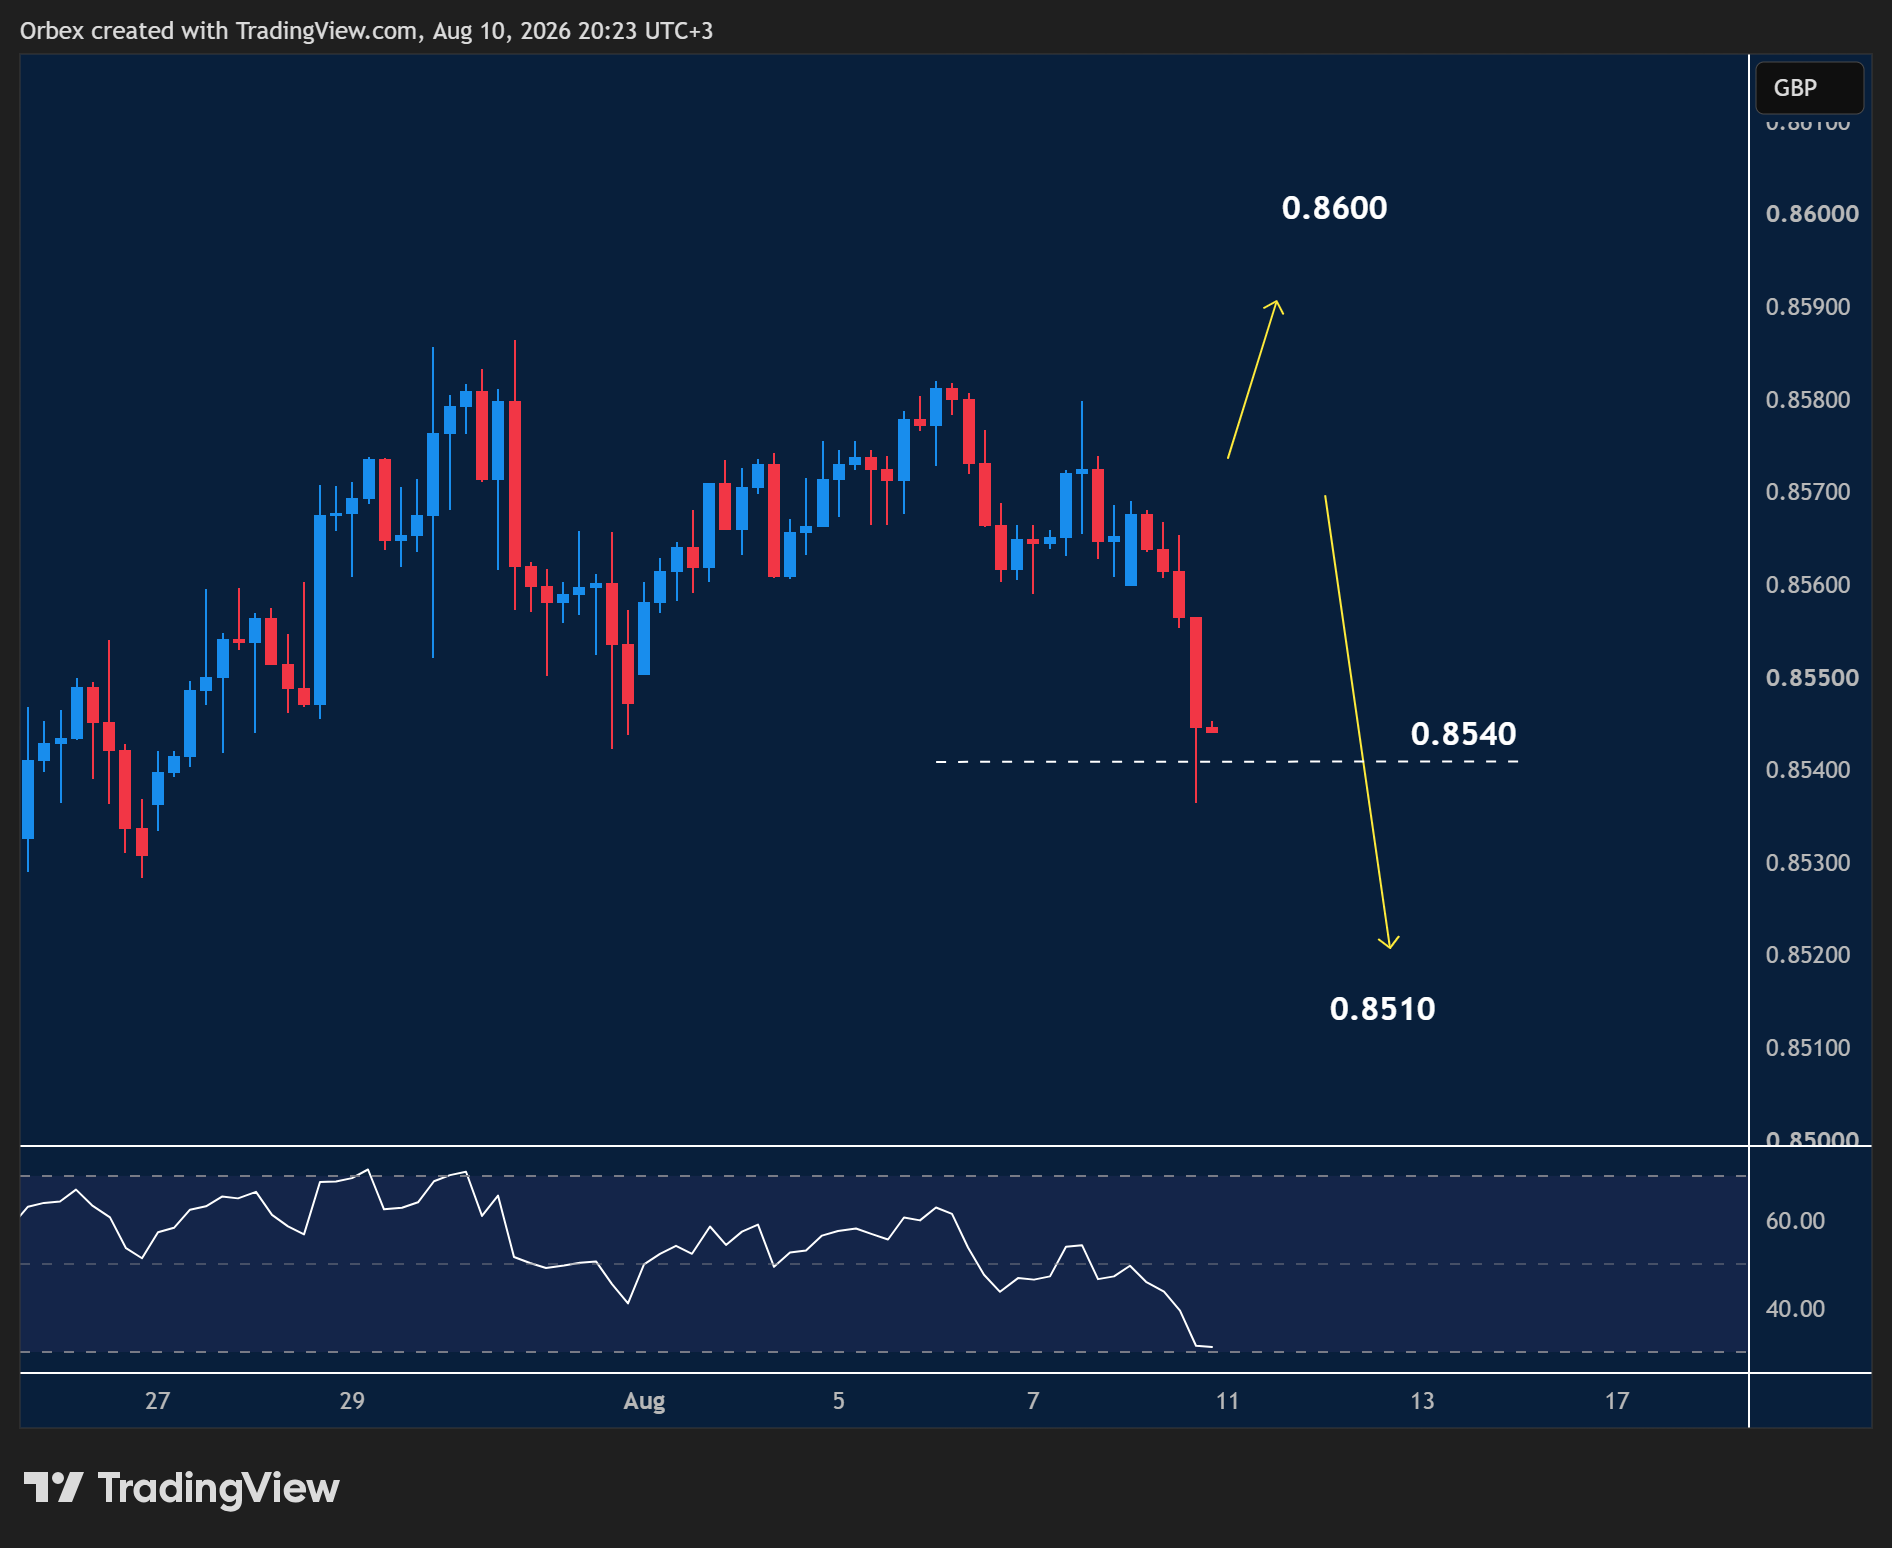
The pound continues to push the boundaries as its impressive comeback against the euro hit another low.
- The latest spike prompted buyers to cover as the pair came under intense pressure.
- A long bearish candle towards the previous low at 0.8540 is a sign of continuation.
- A pullback is needed to stop the rot for the euro to test price action towards the 0.8600 zone.
- 0.8510 is the critical support as the RSI hits the oversold area.
US 30(Dow) waiting for direction
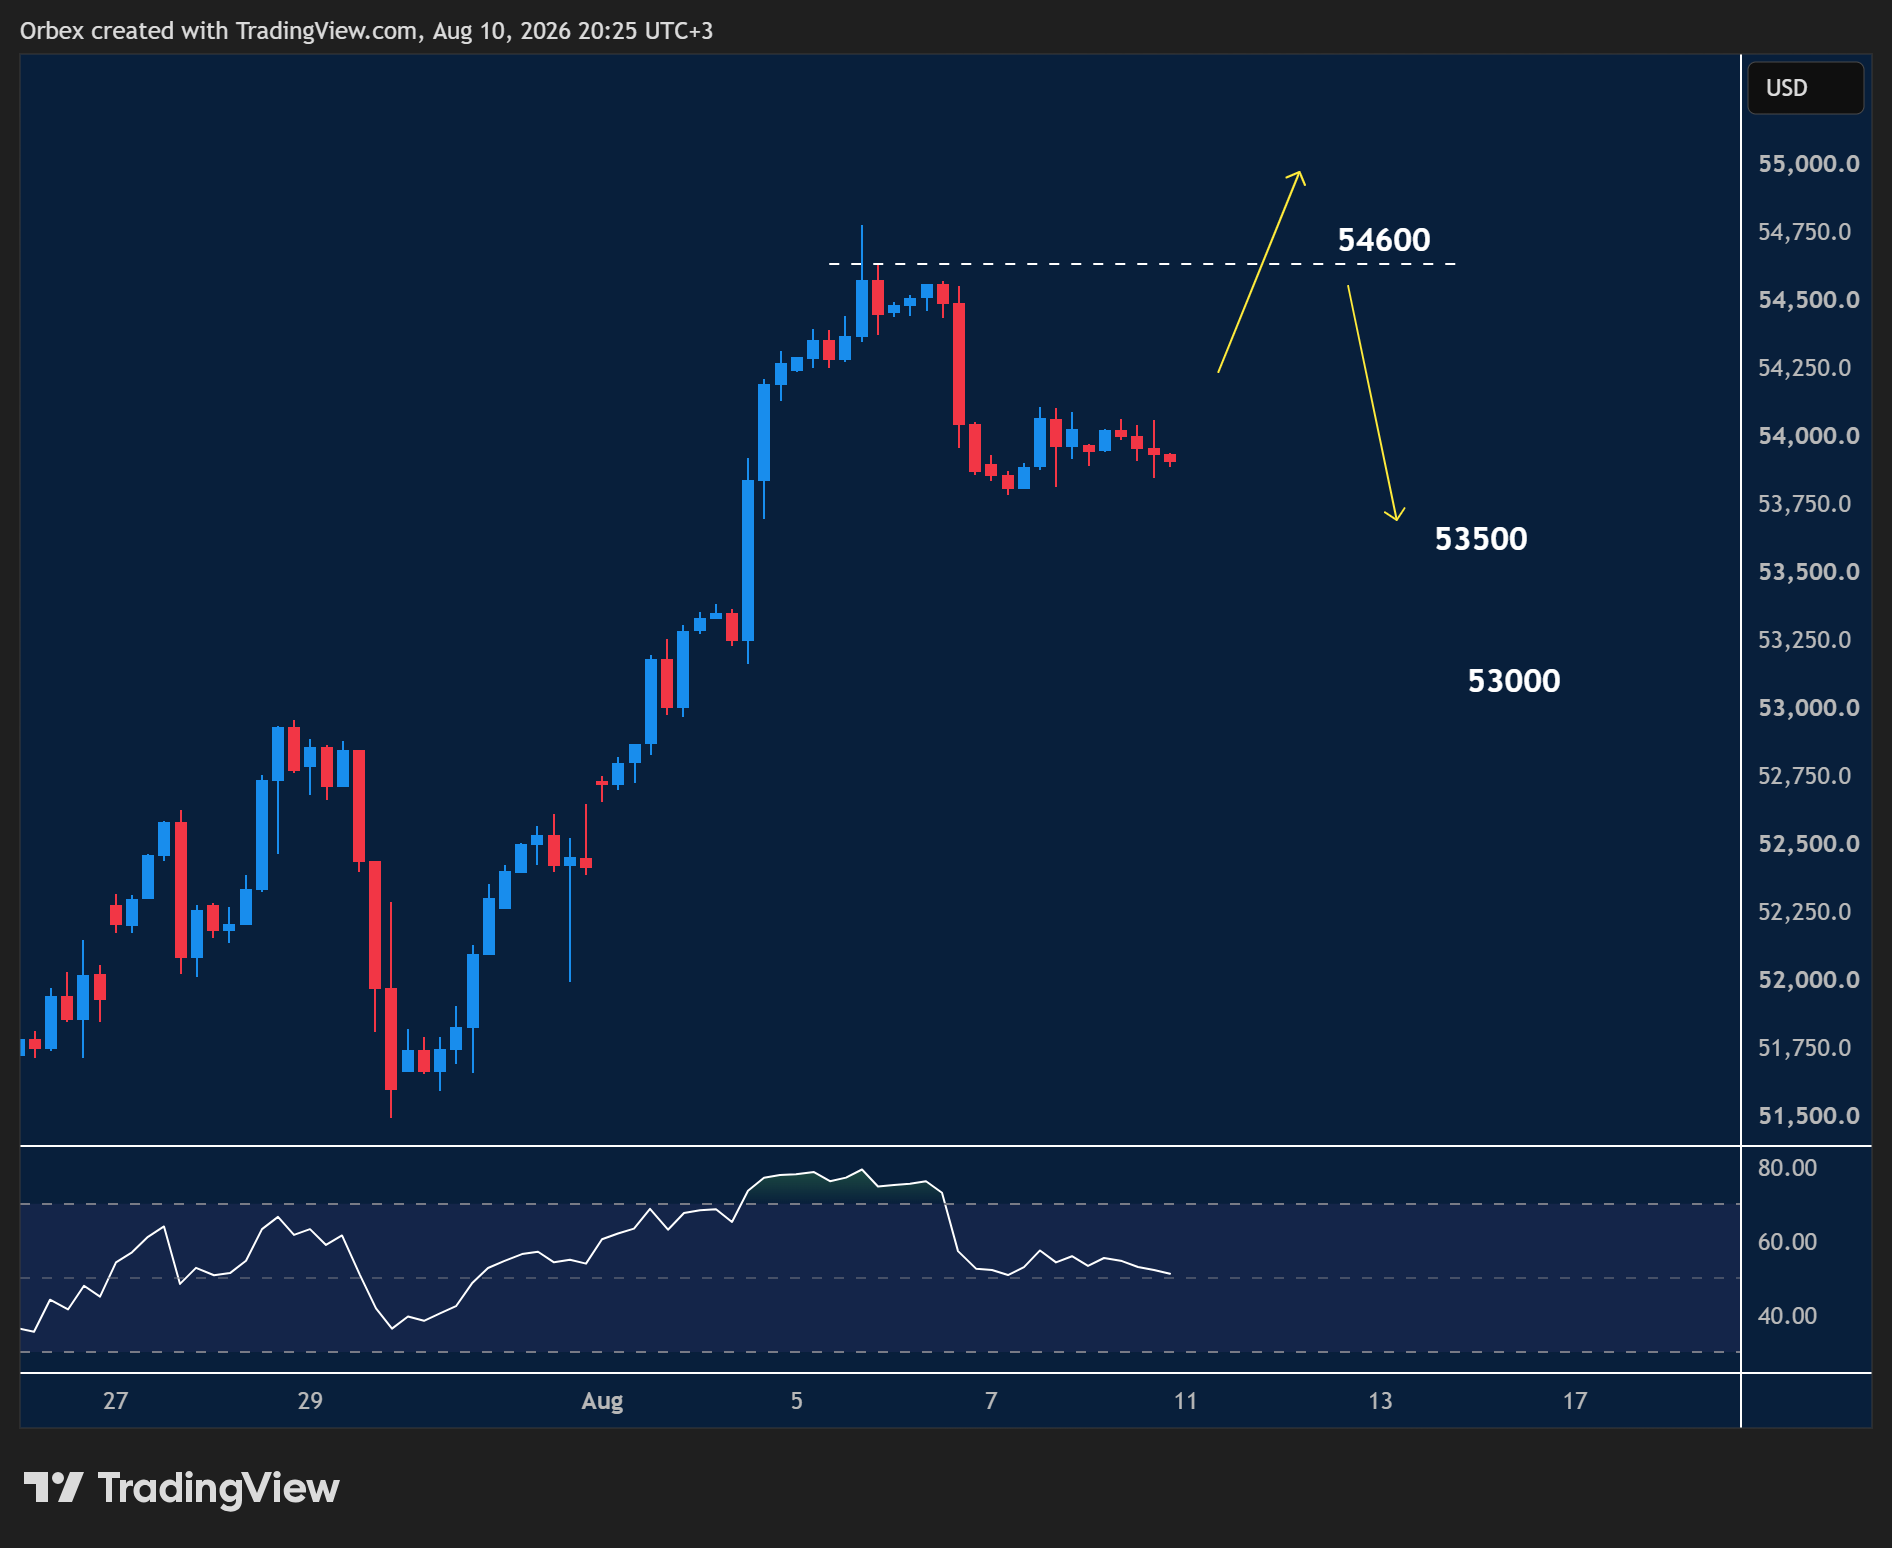
The US 30(Dow) consolidates after the recent bullish run added over 2000 points to the index.
- Price action now looks to lift the key resistance at 54600.
- A fall below 53500 will lead to more profit-taking, putting bulls on the defensive.
- 53000 is the psychological support to see whether sellers will continue entering the market to hit a fresh low.
Trading the forex market requires extensive research, and that’s what we do best



![Credit Card 160×600 [EN]](https://assets.iorbex.com/blog/wp-content/uploads/2023/06/13144507/Blog-Banner_EN-Banner_160X600X2.webp)


