
EURUSD hits resistance
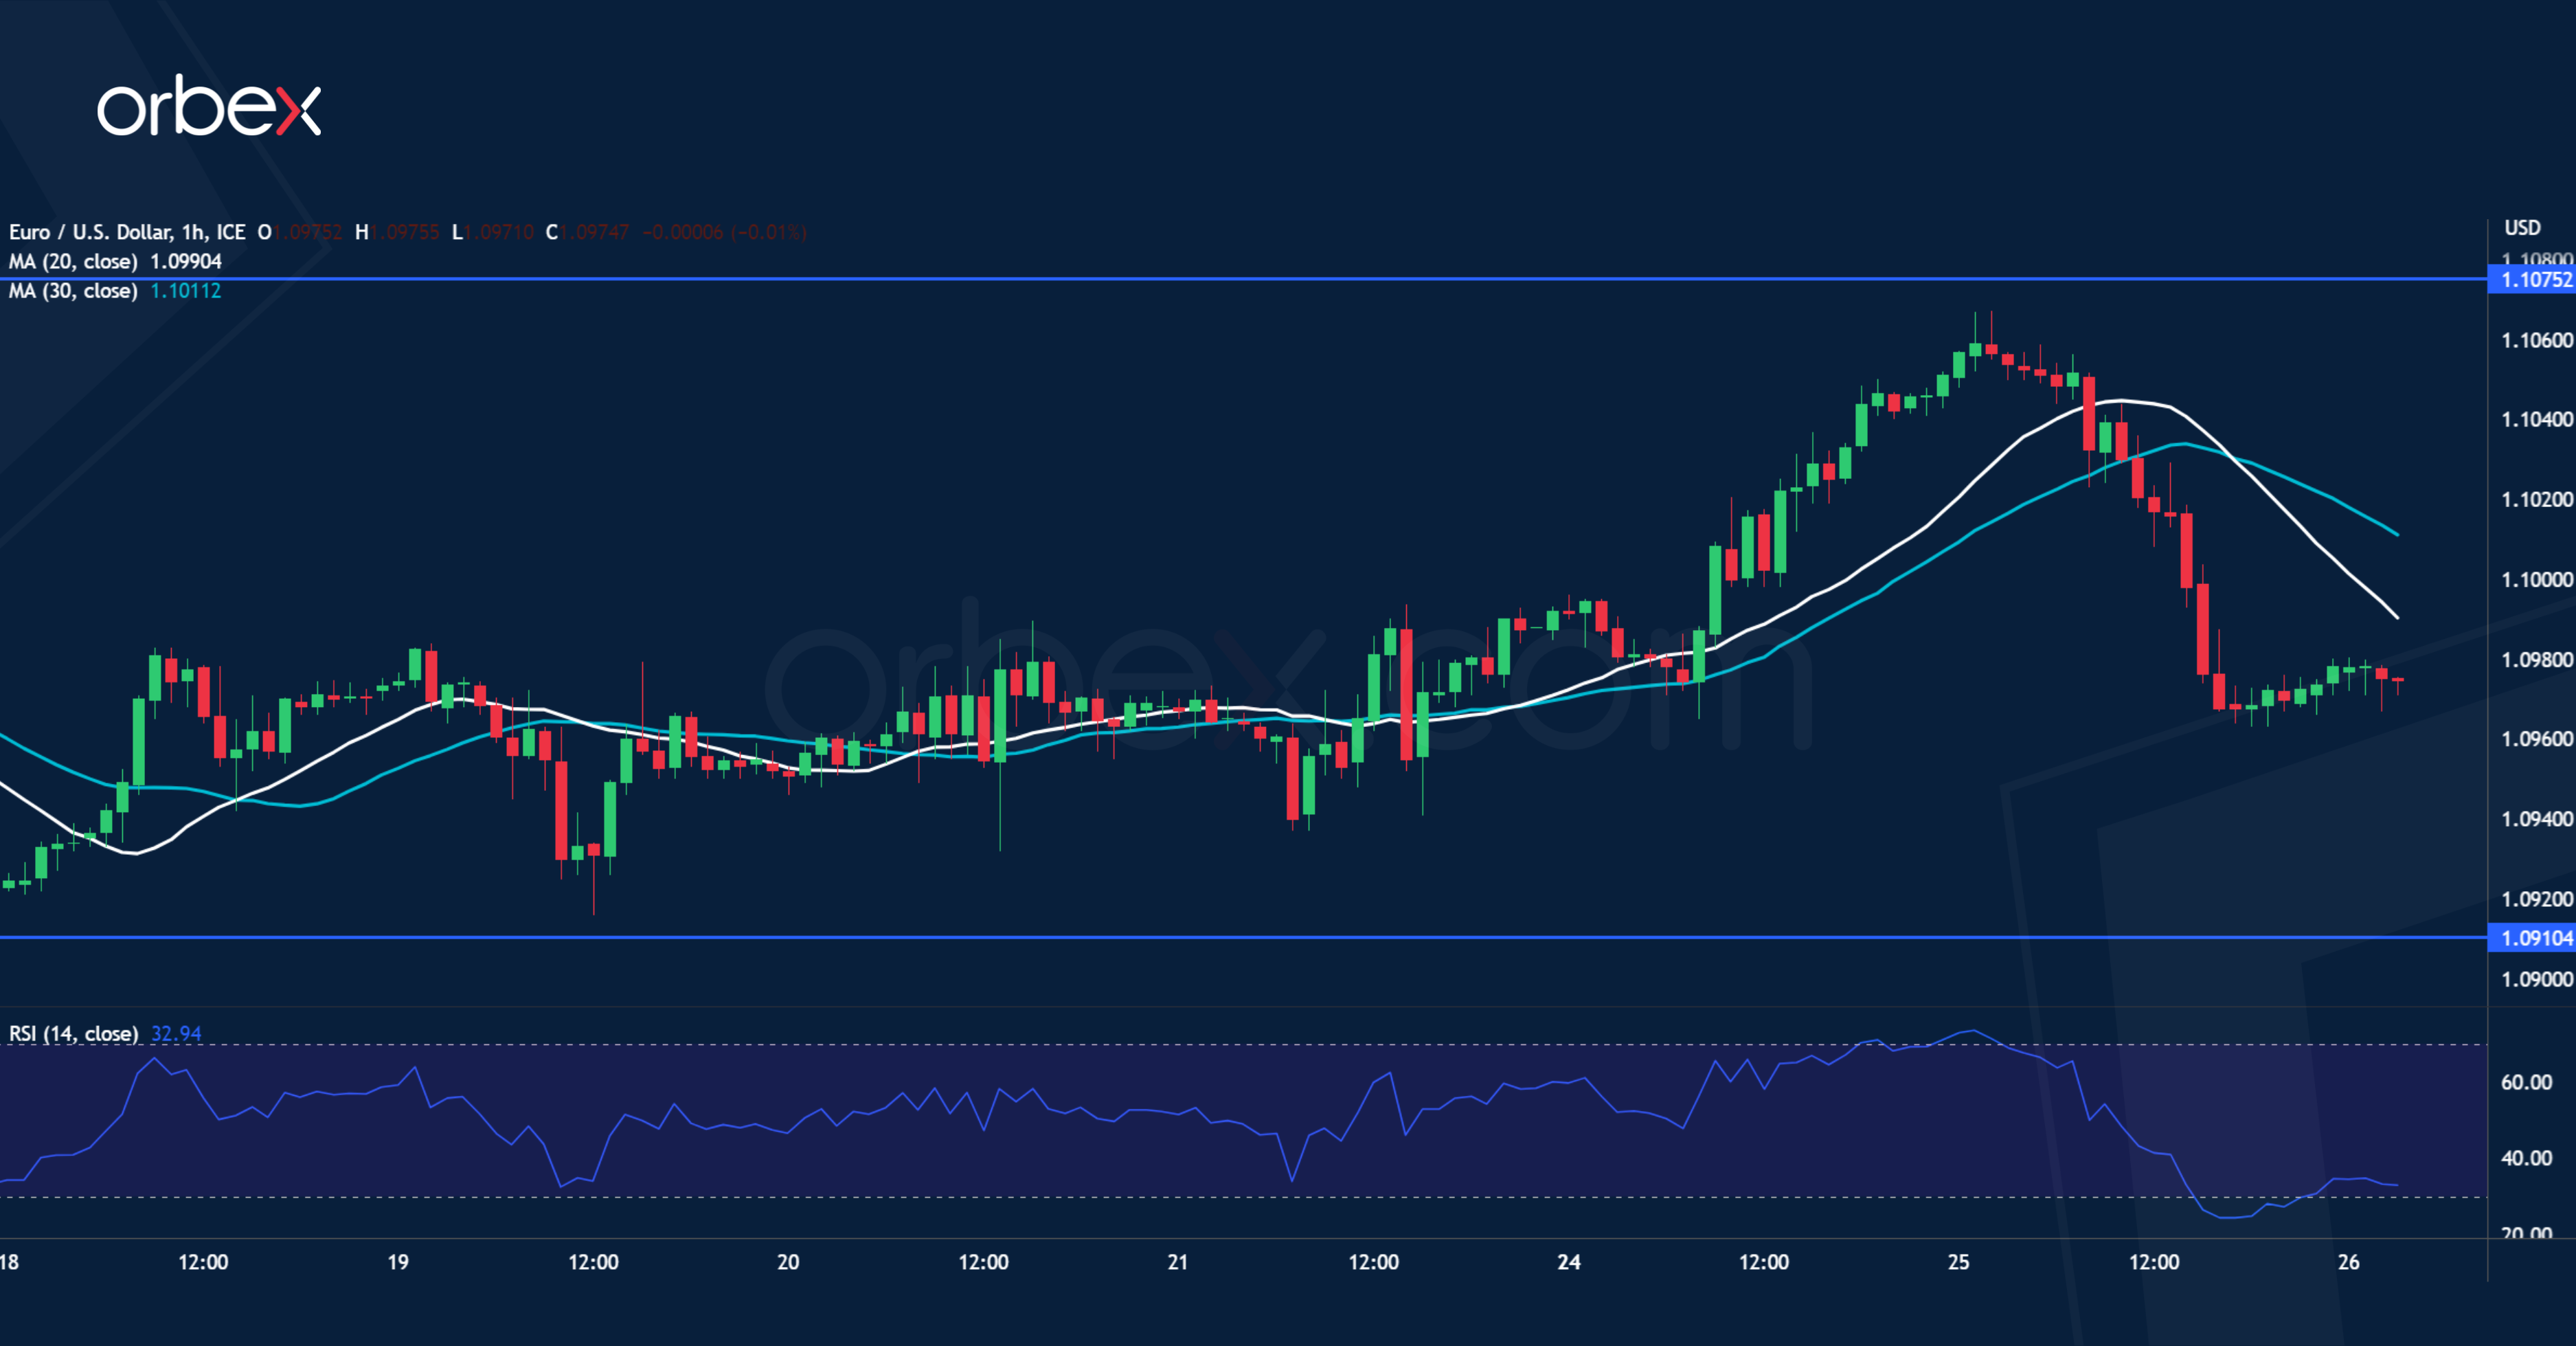
The US dollar clawed back losses with robust new home sales in March. The price is still trying to hold on to recent gains after rallying above this year’s high of 1.1000. A drop below the closest support at 1.0970 has broken the latest momentum and may push short-term buyers to the sidelines. With the RSI showing an oversold condition, 1.0910 at the base of a previous bullish breakout and over the 20-day SMA is likely to be tested. The recent high of 1.1075 is the key hurdle to lift before the bulls could regain control.
AUDUSD breaks lower

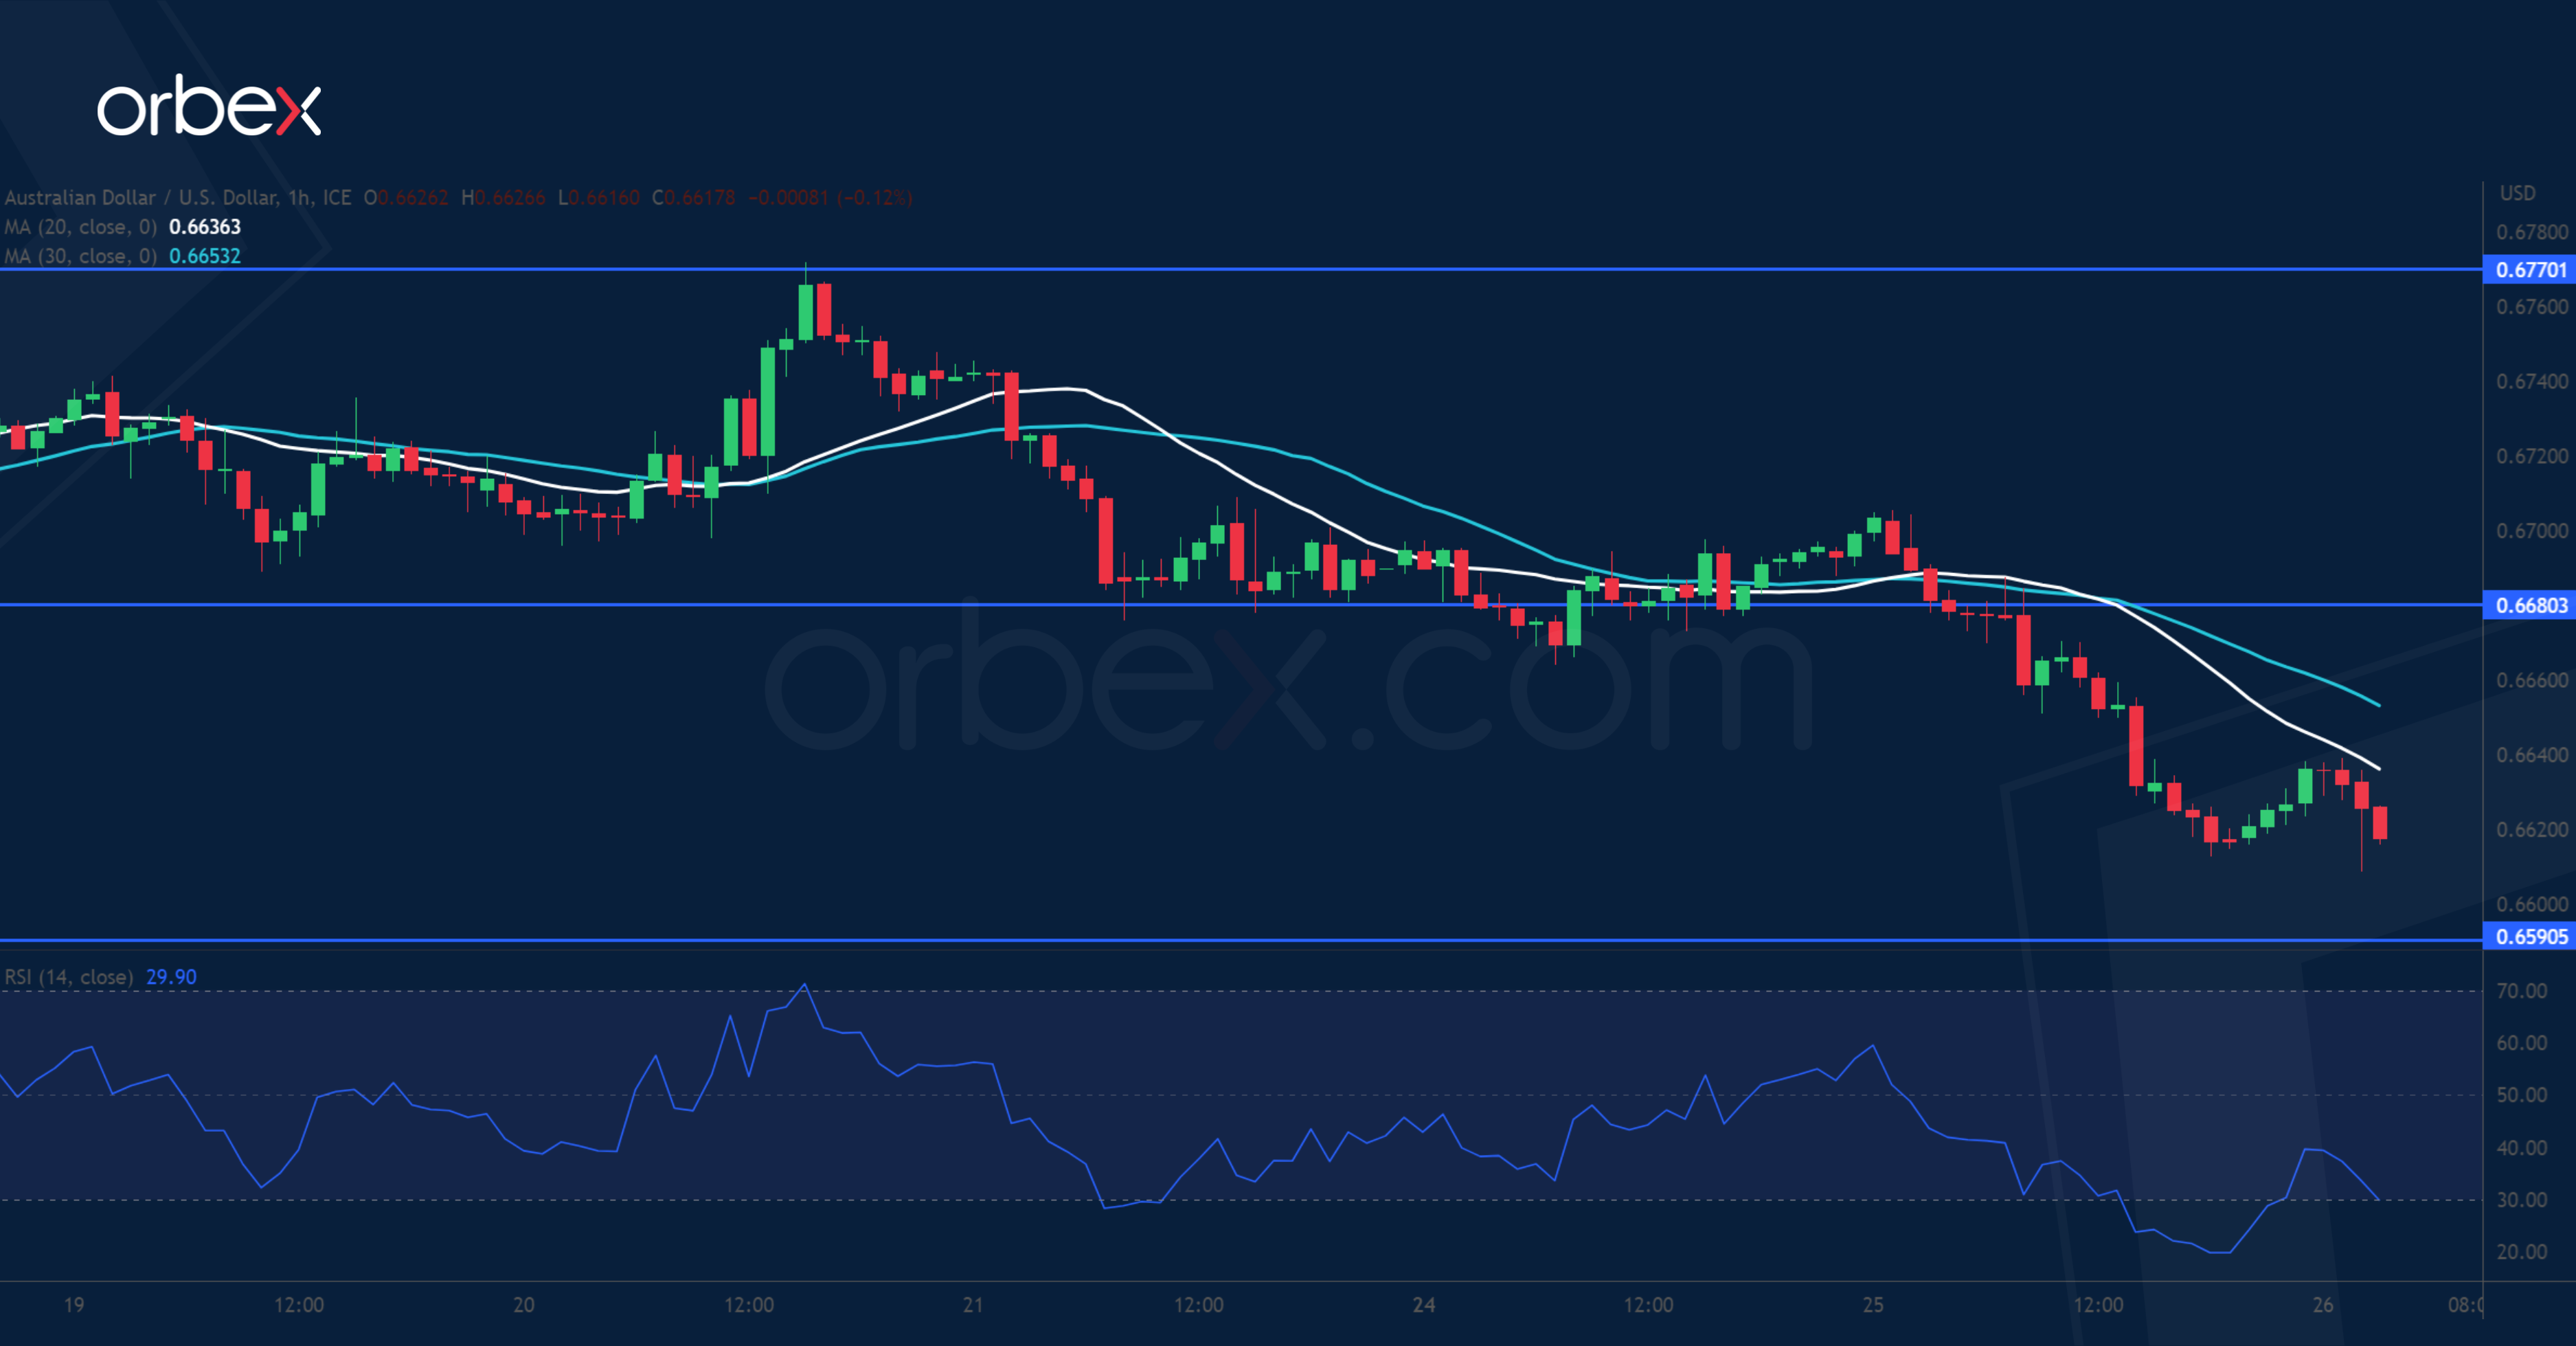
The Australian dollar slipped over a slowdown in Q1 inflation. The pair continues to struggle to stand its ground against growing selling interest despite an upward consolidation for a month and half. The bulls will need to clear 0.6770 before a meaningful recovery could take shape. Instead, a drop below 0.6620 showed little commitment from the buy side, and could potentially lead to a broader liquidation below the March lows of 0.6590. 0.6680 is a fresh resistance as the RSI attempts to recover into the neutral zone.
UK 100 drifts lower
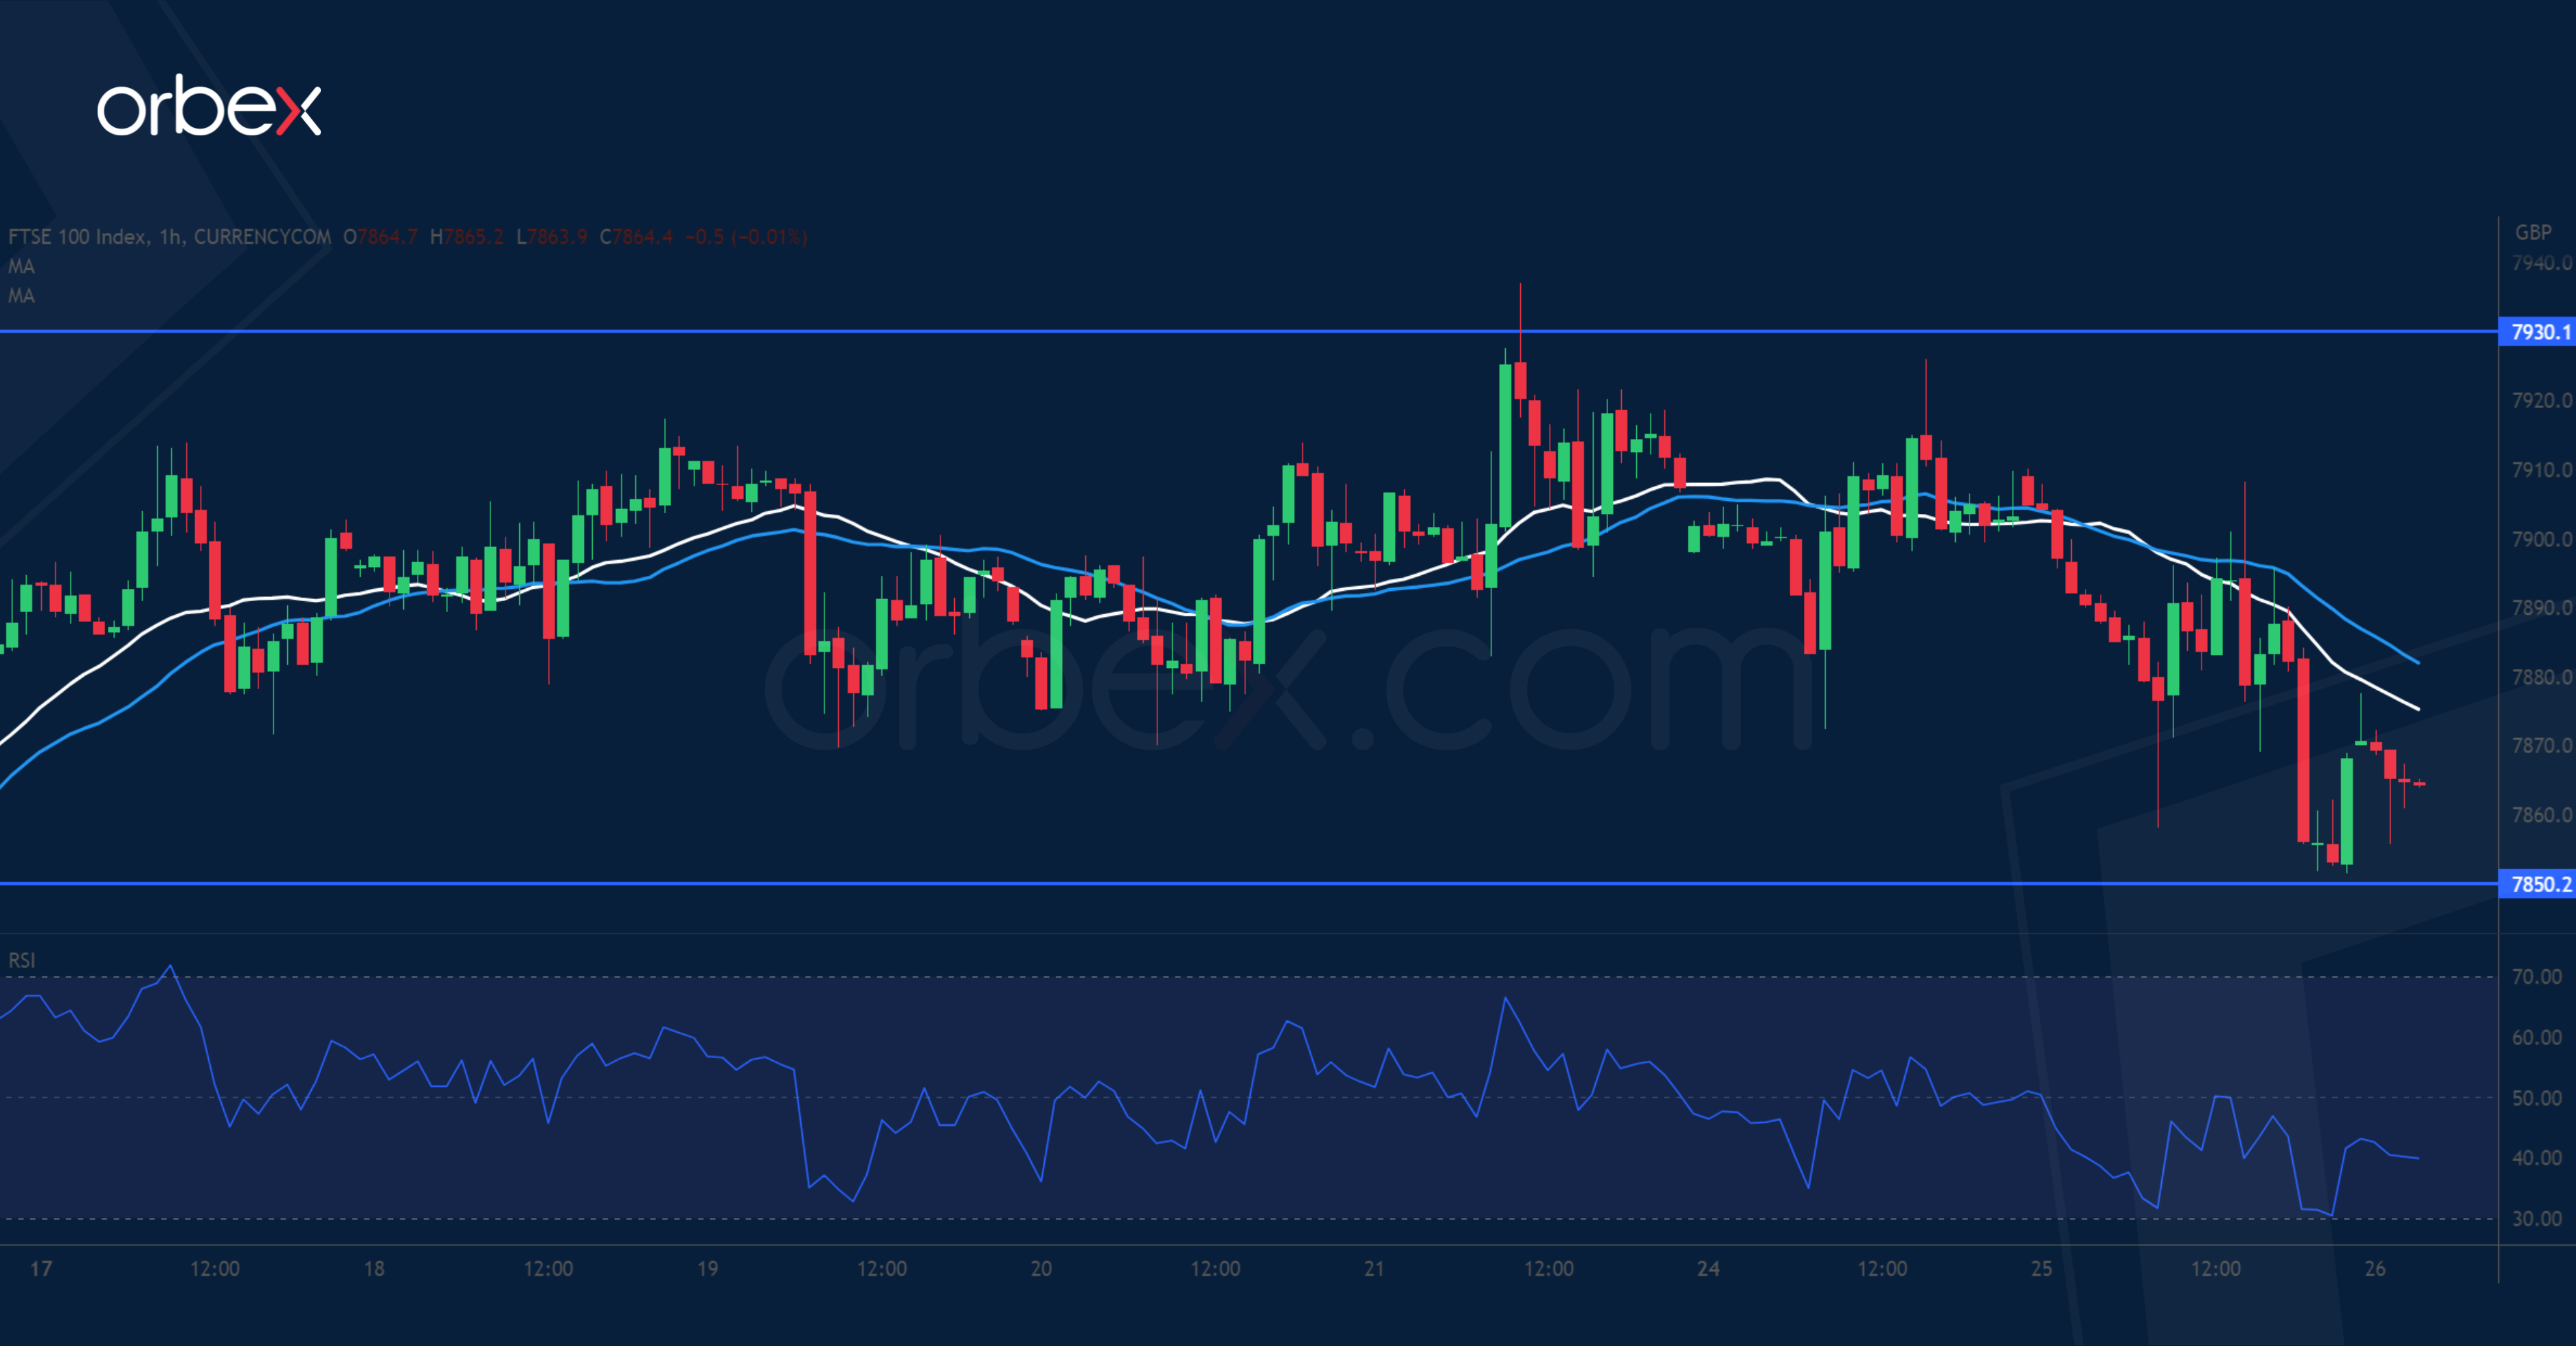
The FTSE 100 softened as tumbling deposits at First Republic Bank renewed fears about the banking sector. The V-shaped rally has put the index back right under this year’s high with the supply zone 7930-7970 being the bears’ last stronghold. A bullish breakout would signal a continuation to a new all-time high above 8040. However, the bulls would need to catch their breath and consolidate their gains. 7850 is first to assess follow-up interest as the price goes horizontal. A deeper correction would test 7775 on the 20-day SMA.

![Credit Card 160×600 [EN]](https://assets.iorbex.com/blog/wp-content/uploads/2023/06/13144507/Blog-Banner_EN-Banner_160X600X2.webp)