
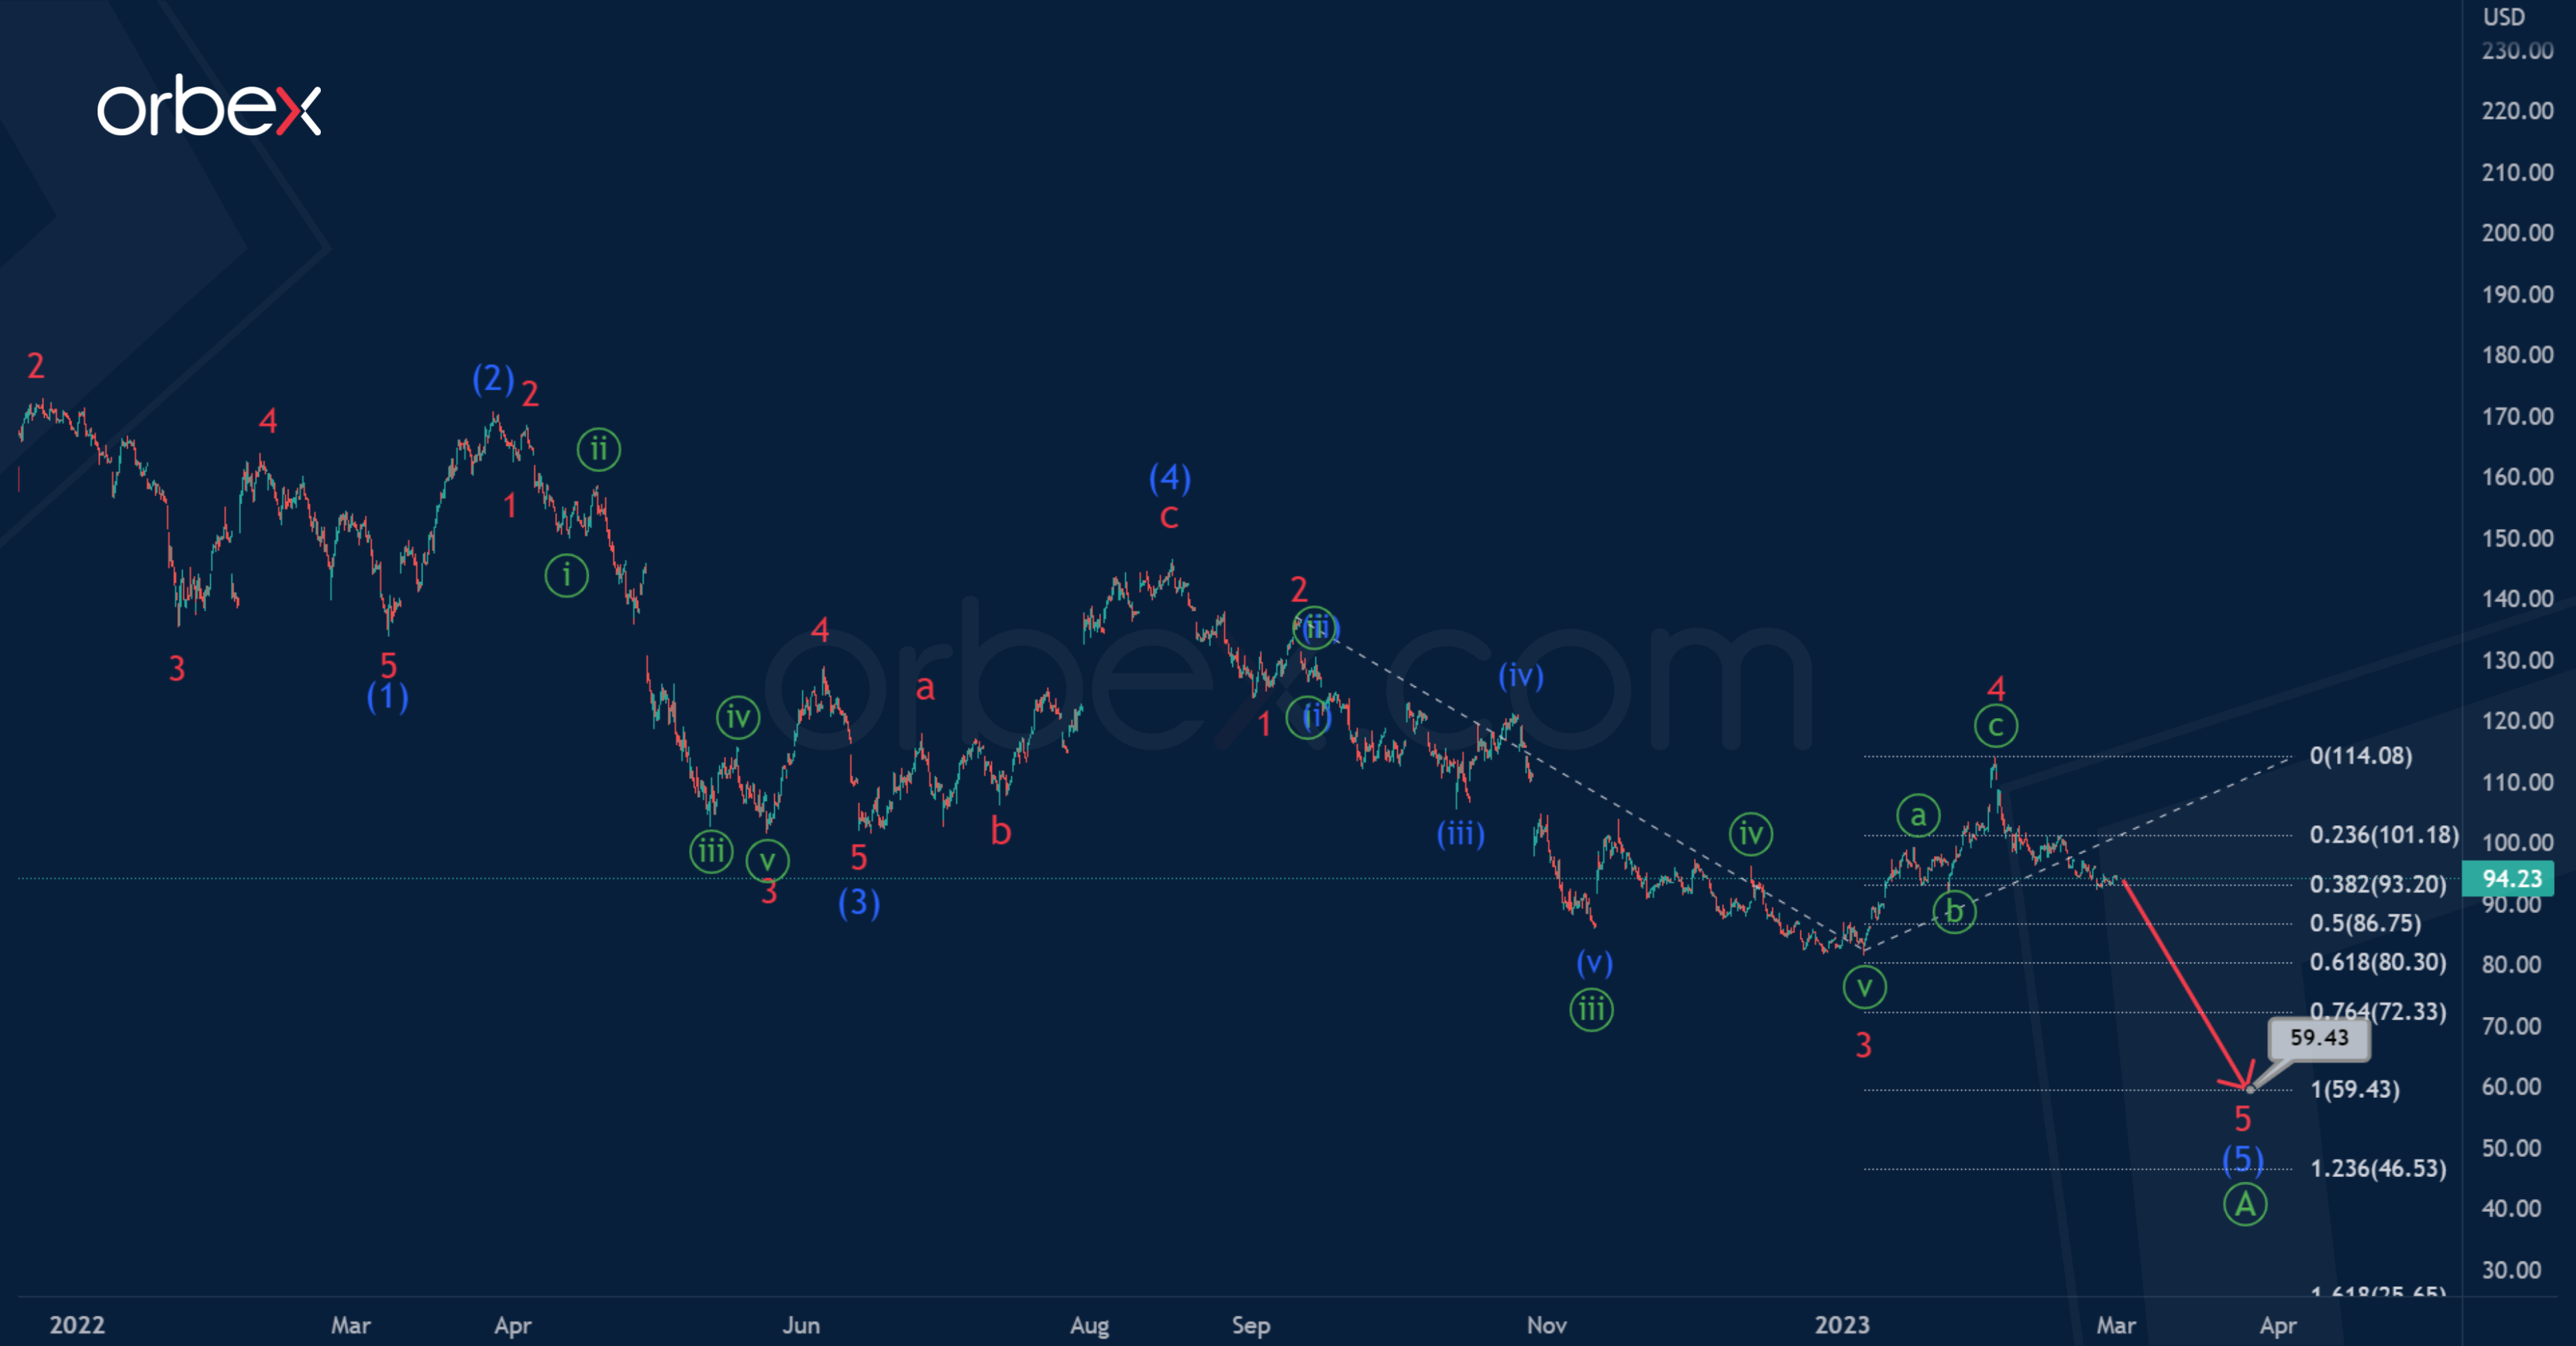
From a global perspective, AMZN seems to be forming a bearish correction wave b. This takes the form of a primary zigzag Ⓐ-Ⓑ-Ⓒ.
In the next coming trading days, we can expect the stock depreciation to continue in the final intermediate wave (5) of the leading diagonal Ⓐ to 72.04. At that level, minor wave 5 will be at 76.4% of the previous impulse.
Then, after the end of the wave Ⓐ, a new primary correction Ⓑ is expected to develop.

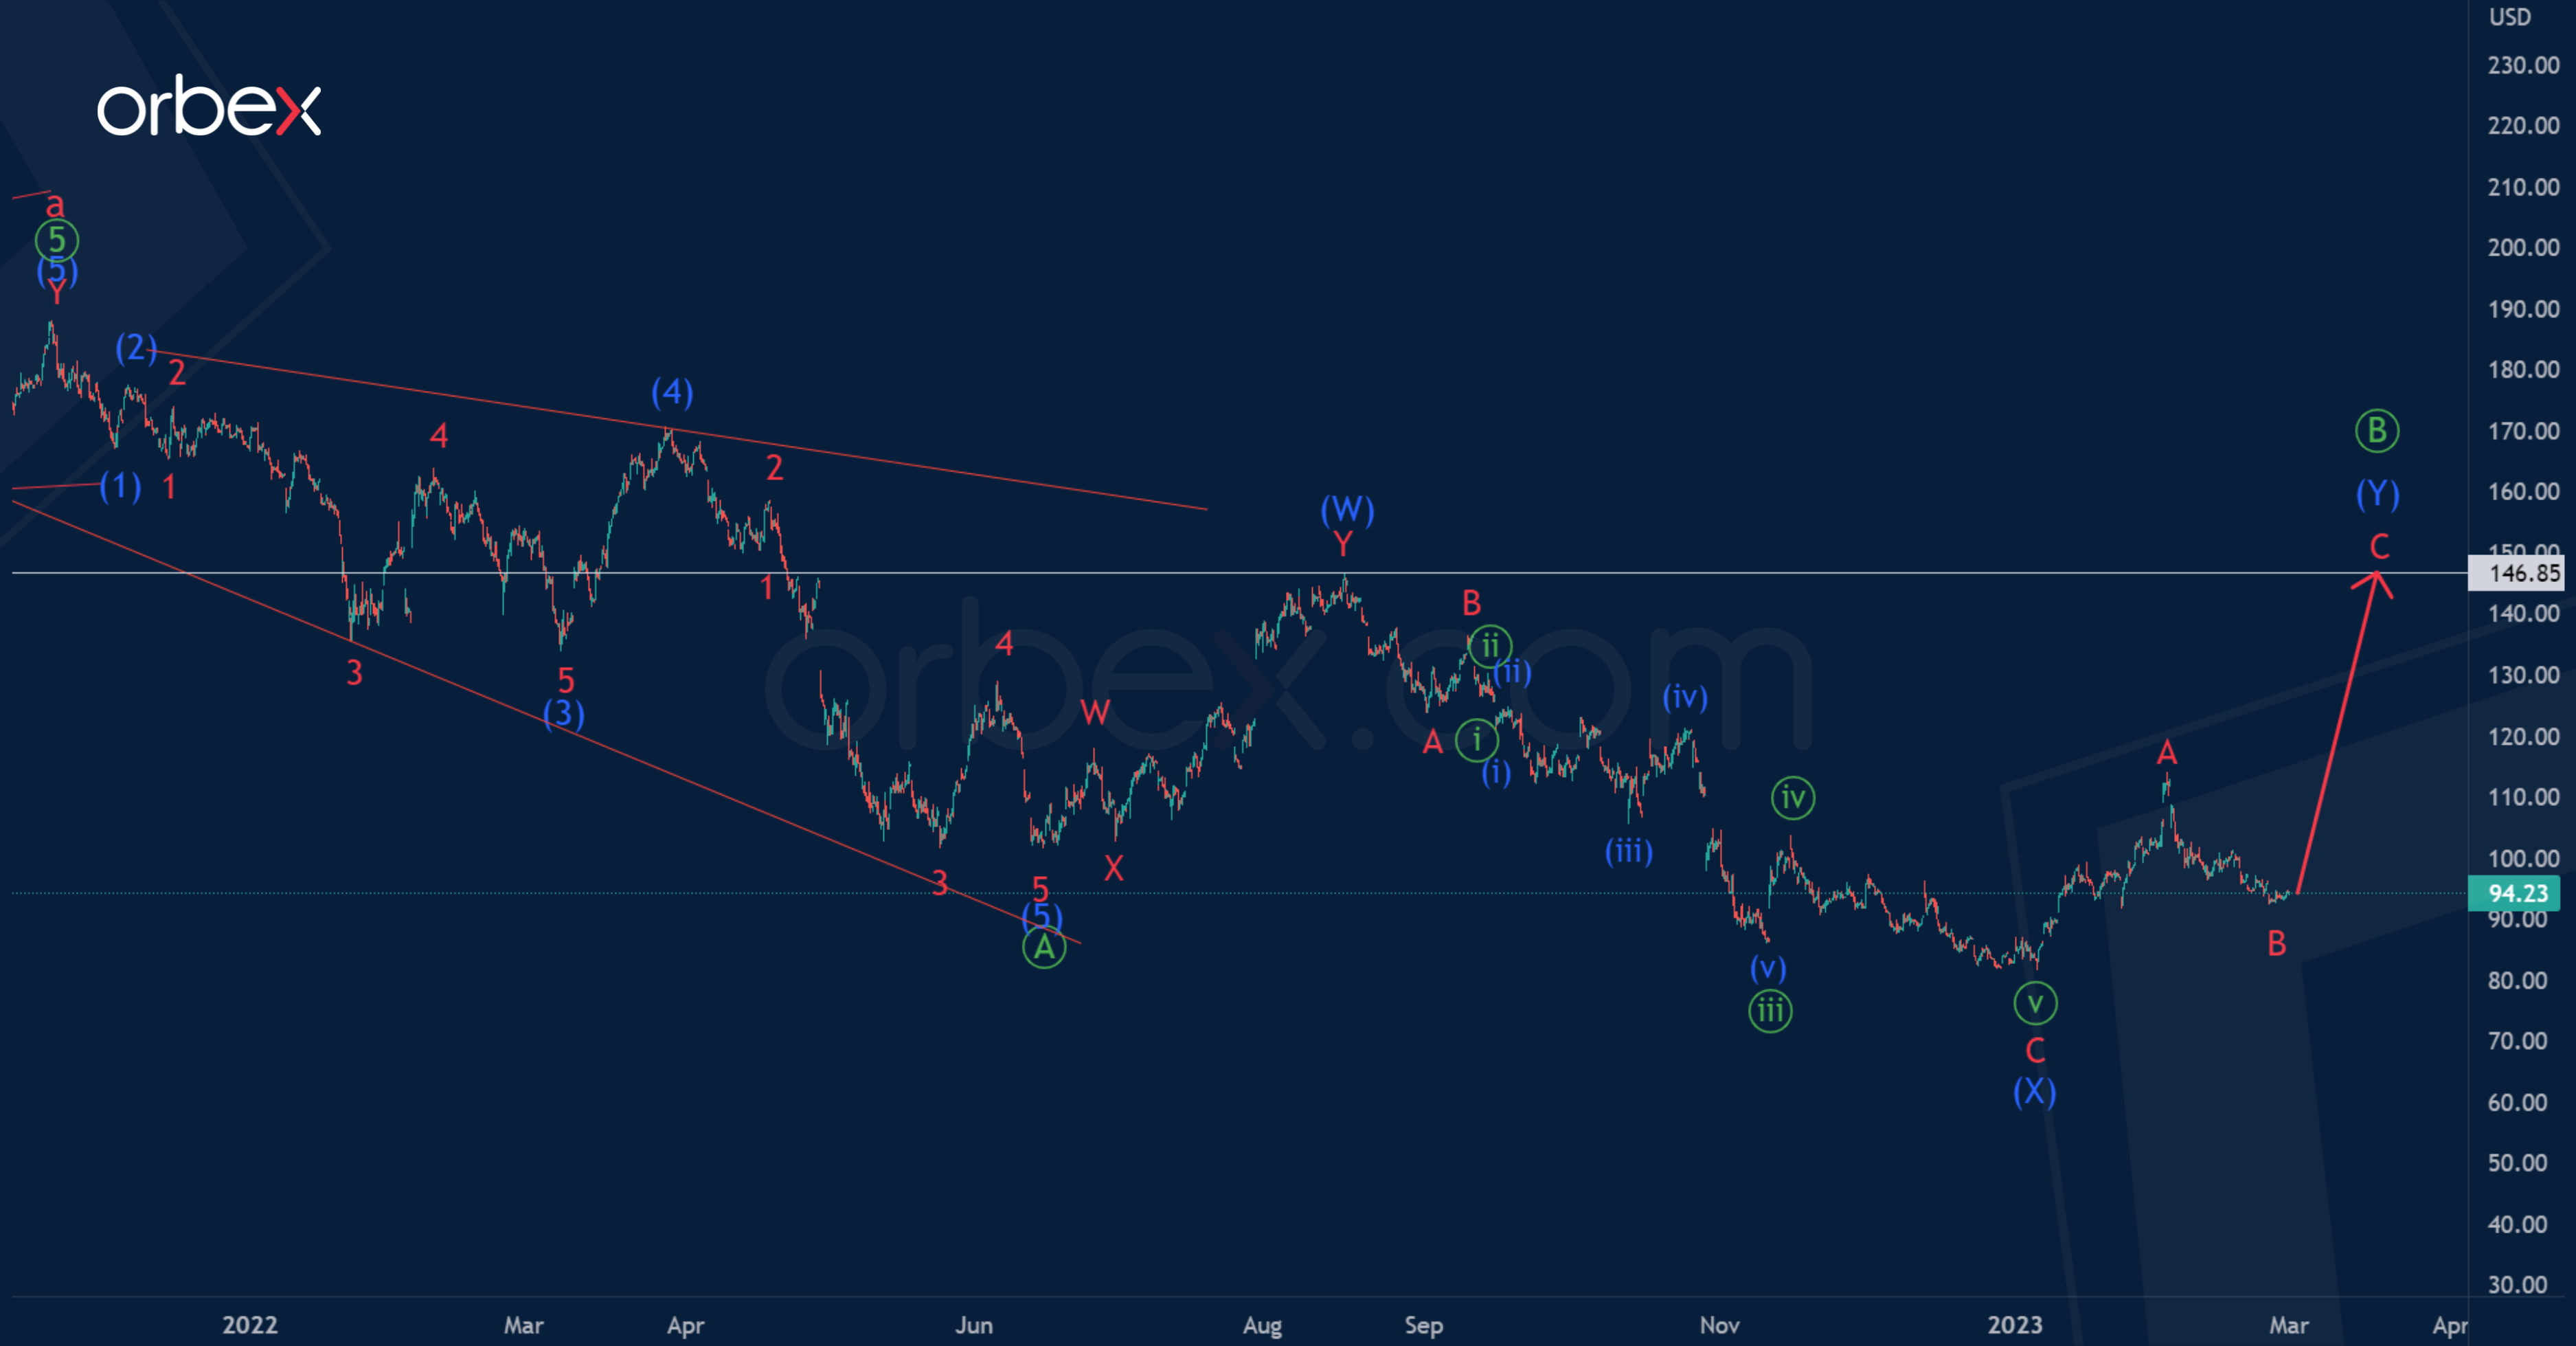
Let’s look at an alternative where the leading diagonal Ⓐ is fully completed, and the price is rising within the sideways correction Ⓑ.
It is assumed that the correction wave Ⓑ will take the form of an intermediate double three (W)-(X)-(Y). The second intervening wave (X) has come to an end.
Thus, an upward movement in the final wave (Y) to a maximum of 146.85 is expected in the coming days. It can take the form of a minor zigzag A-B-C.

![Credit Card 160×600 [EN]](https://assets.iorbex.com/blog/wp-content/uploads/2023/06/13144507/Blog-Banner_EN-Banner_160X600X2.webp)