
USDCHF finds support
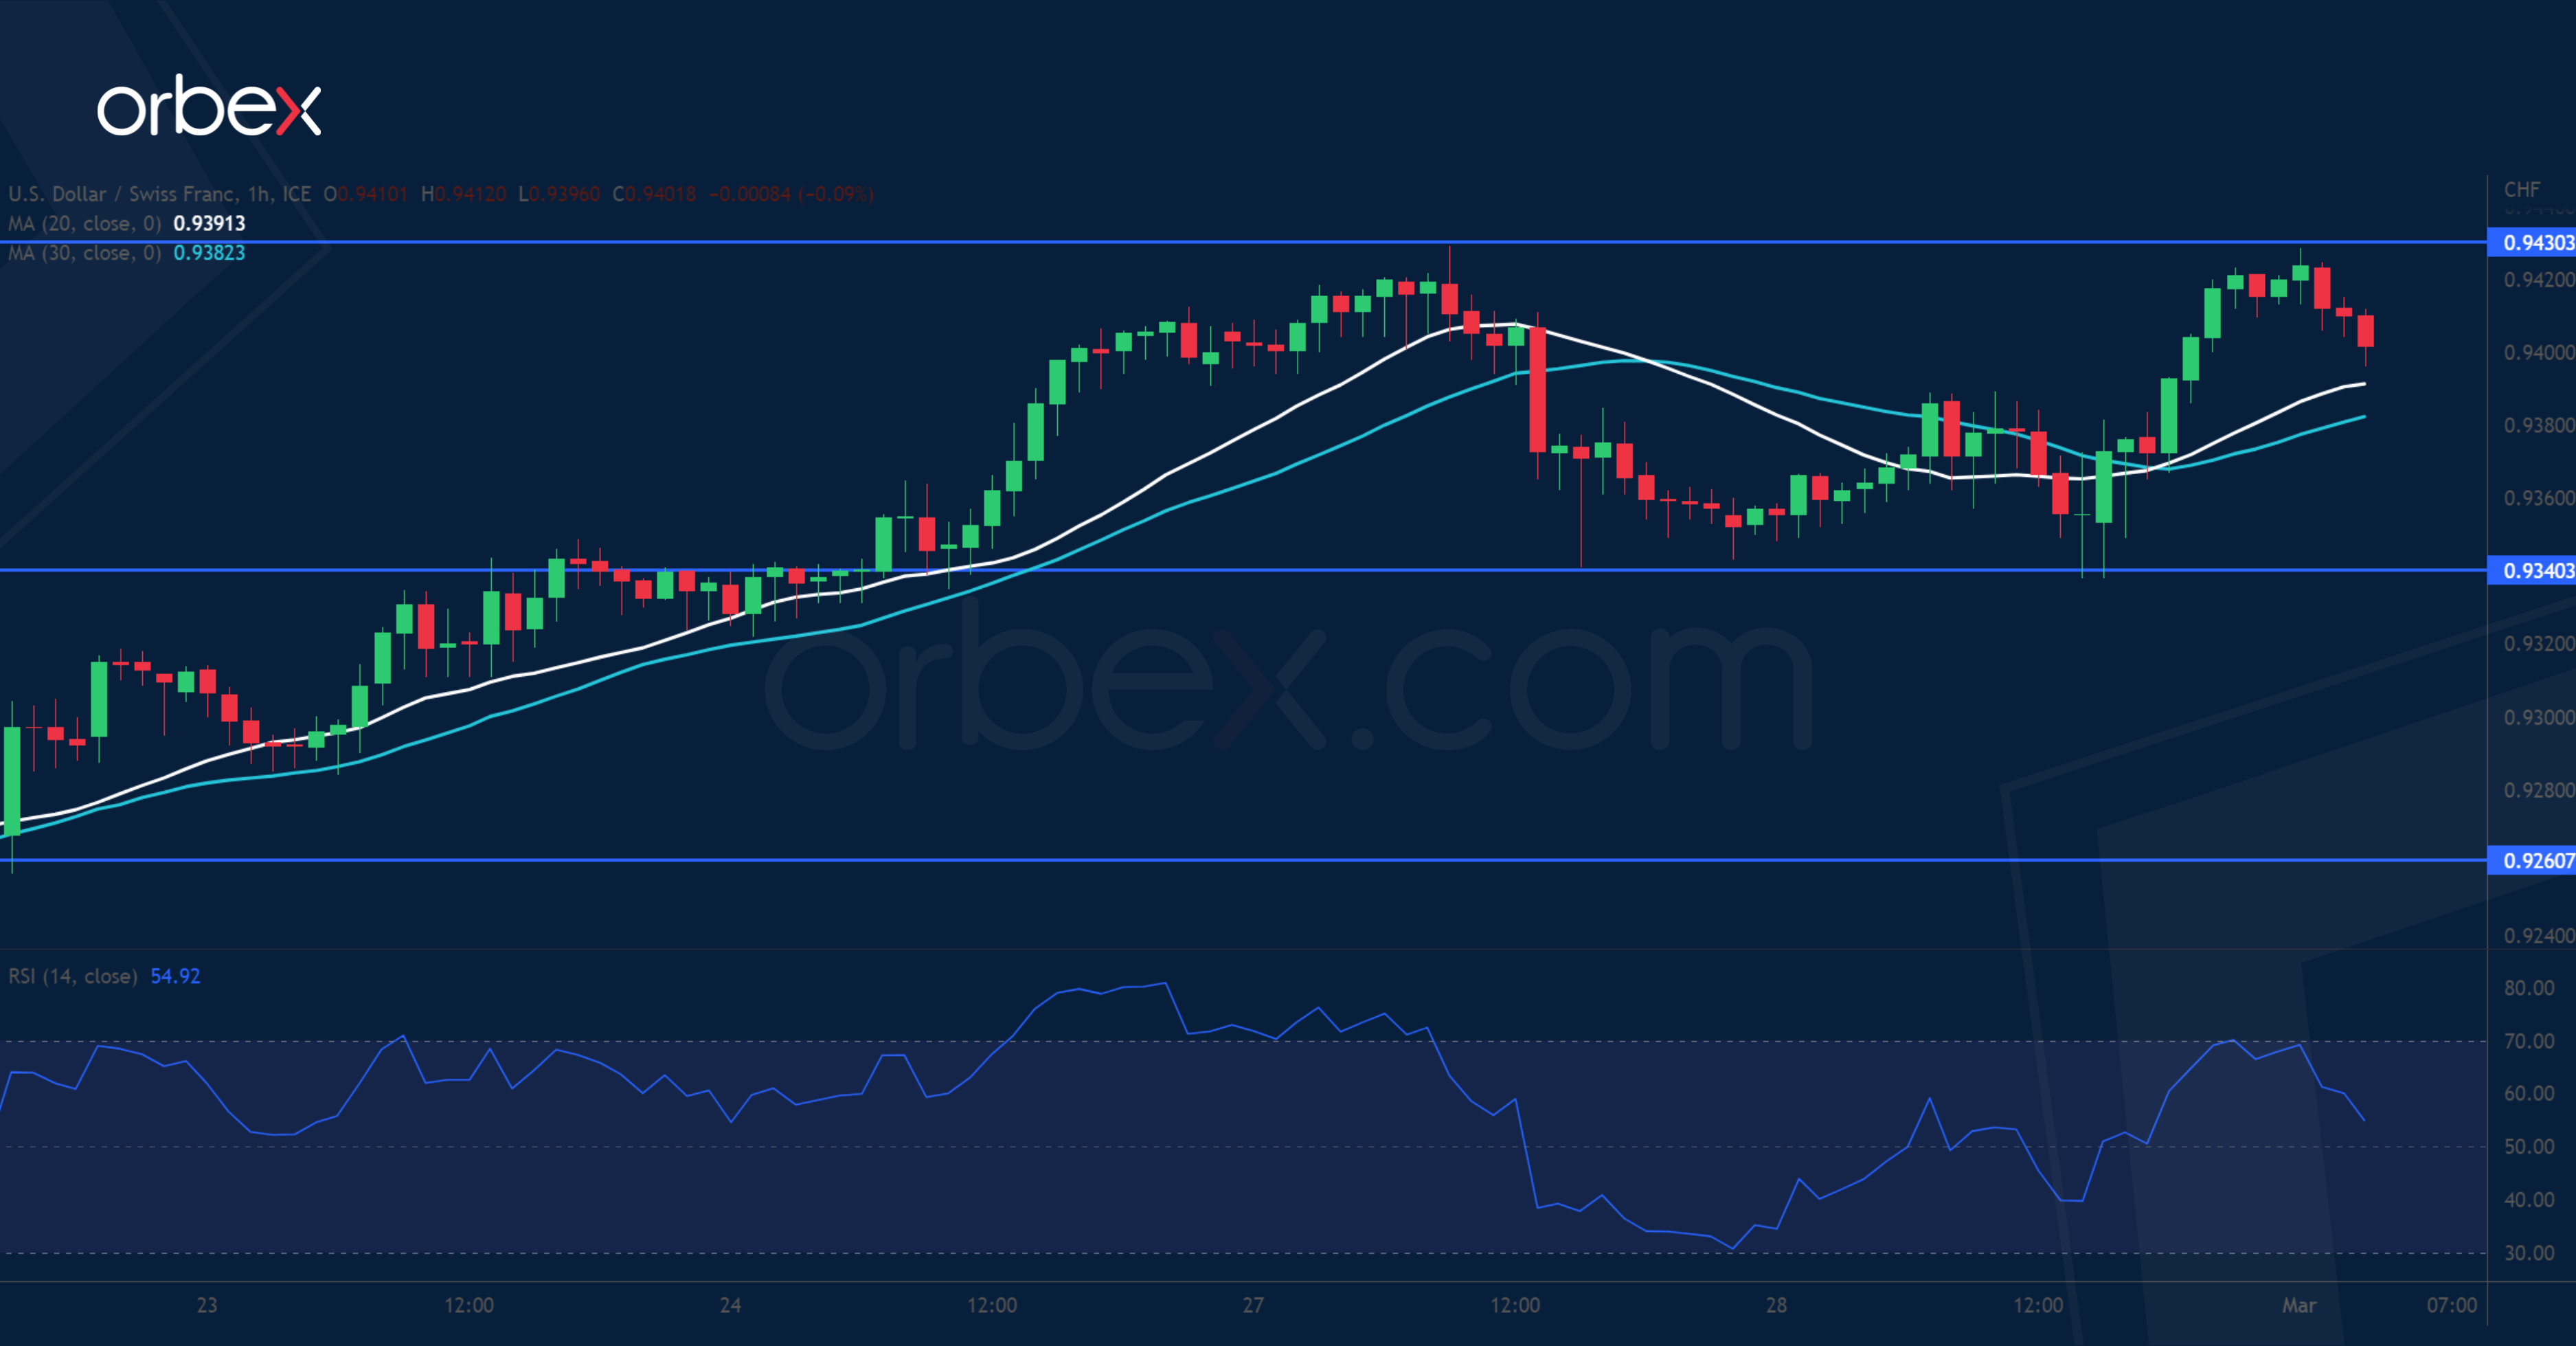
The Swiss franc fell after the annual GDP barely avoided a contraction in Q4. On the daily chart, a close above January’s high of 0.9400 and a bullish MA cross show that sentiment is turning around. Now that the direction is skewed to the upside, traders see pullbacks as opportunities to buy at a discount. The latest retracement came to a halt at 0.9340 and 0.9260 over the 20-day SMA is the second layer of defence. A close back above 0.9430 would pave the way for an extended rally towards the supply area around 0.9500.
USDCAD consolidates gains

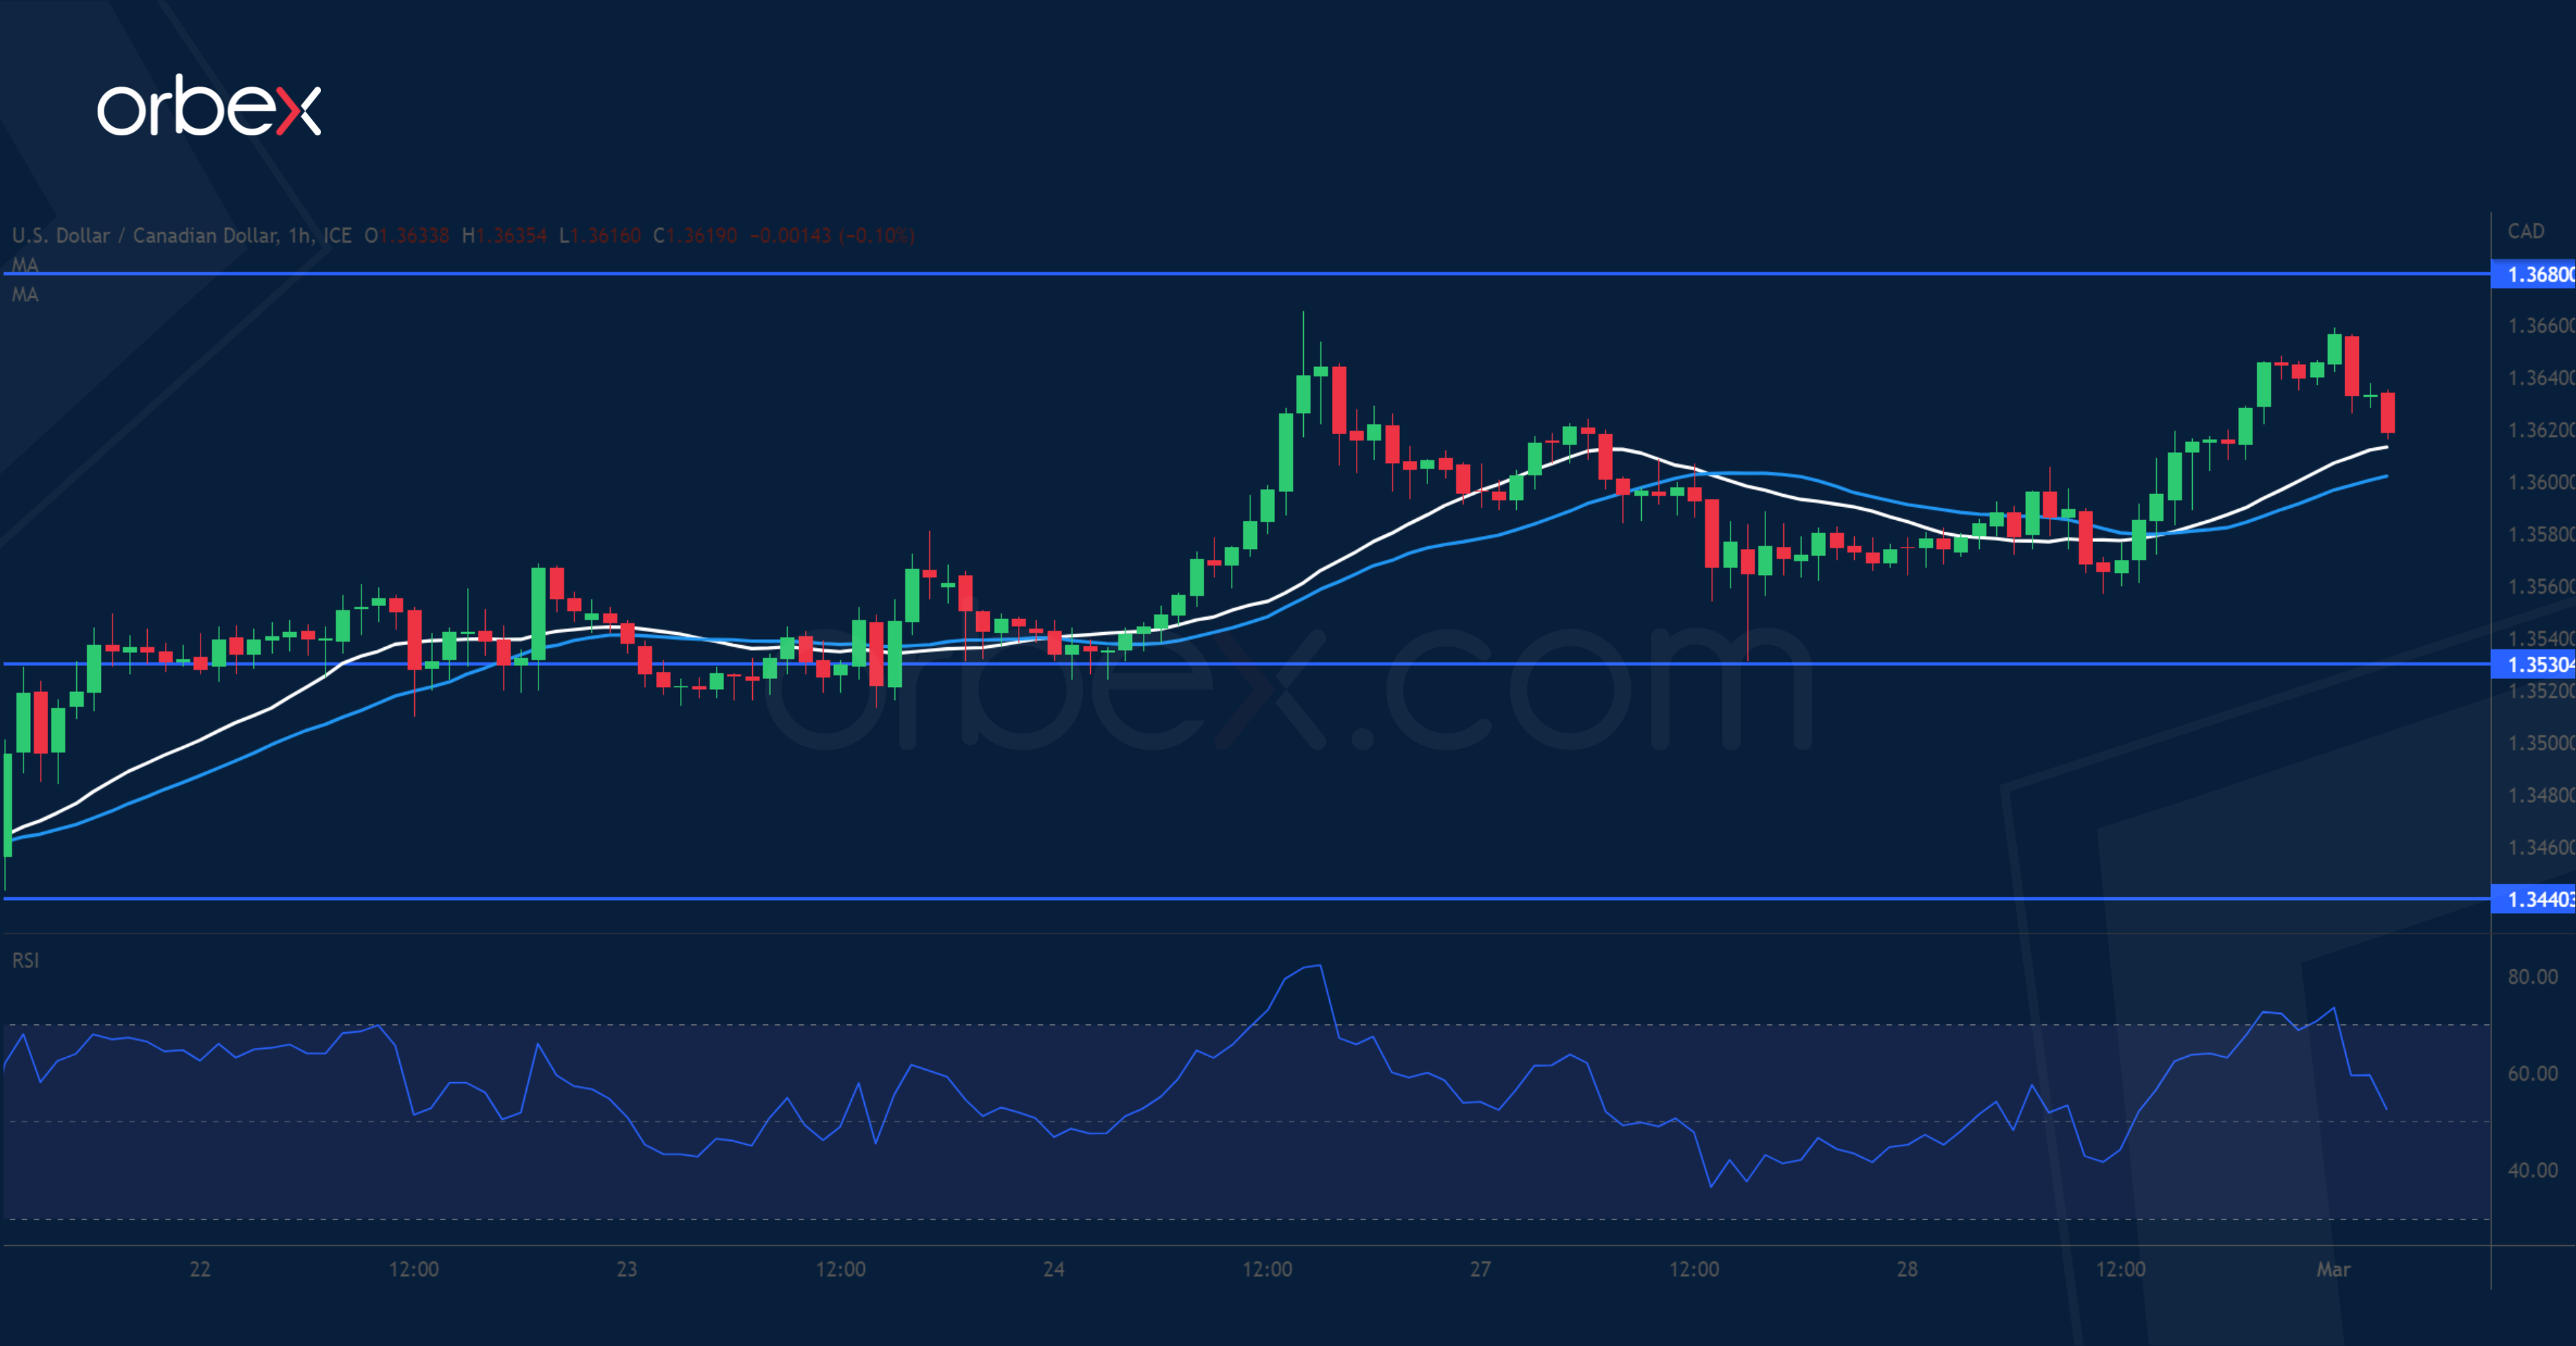
The Canadian dollar softened after the economy unexpectedly stalled in Q4. On the daily chart, the pair is looking to come out of its five-month long consolidation, but stiff selling pressure has kept the price below the top band and January’s peak of 1.3680. A bounce off 1.3530 is a sign of follow-up interest. Further down, the confluence of the previous swing low of 1.3440 and the 20-day SMA is a significant support. A decisive break above 1.3680 would trigger a runaway rally and resume the uptrend in the medium-term.
UK 100 struggles to bounce
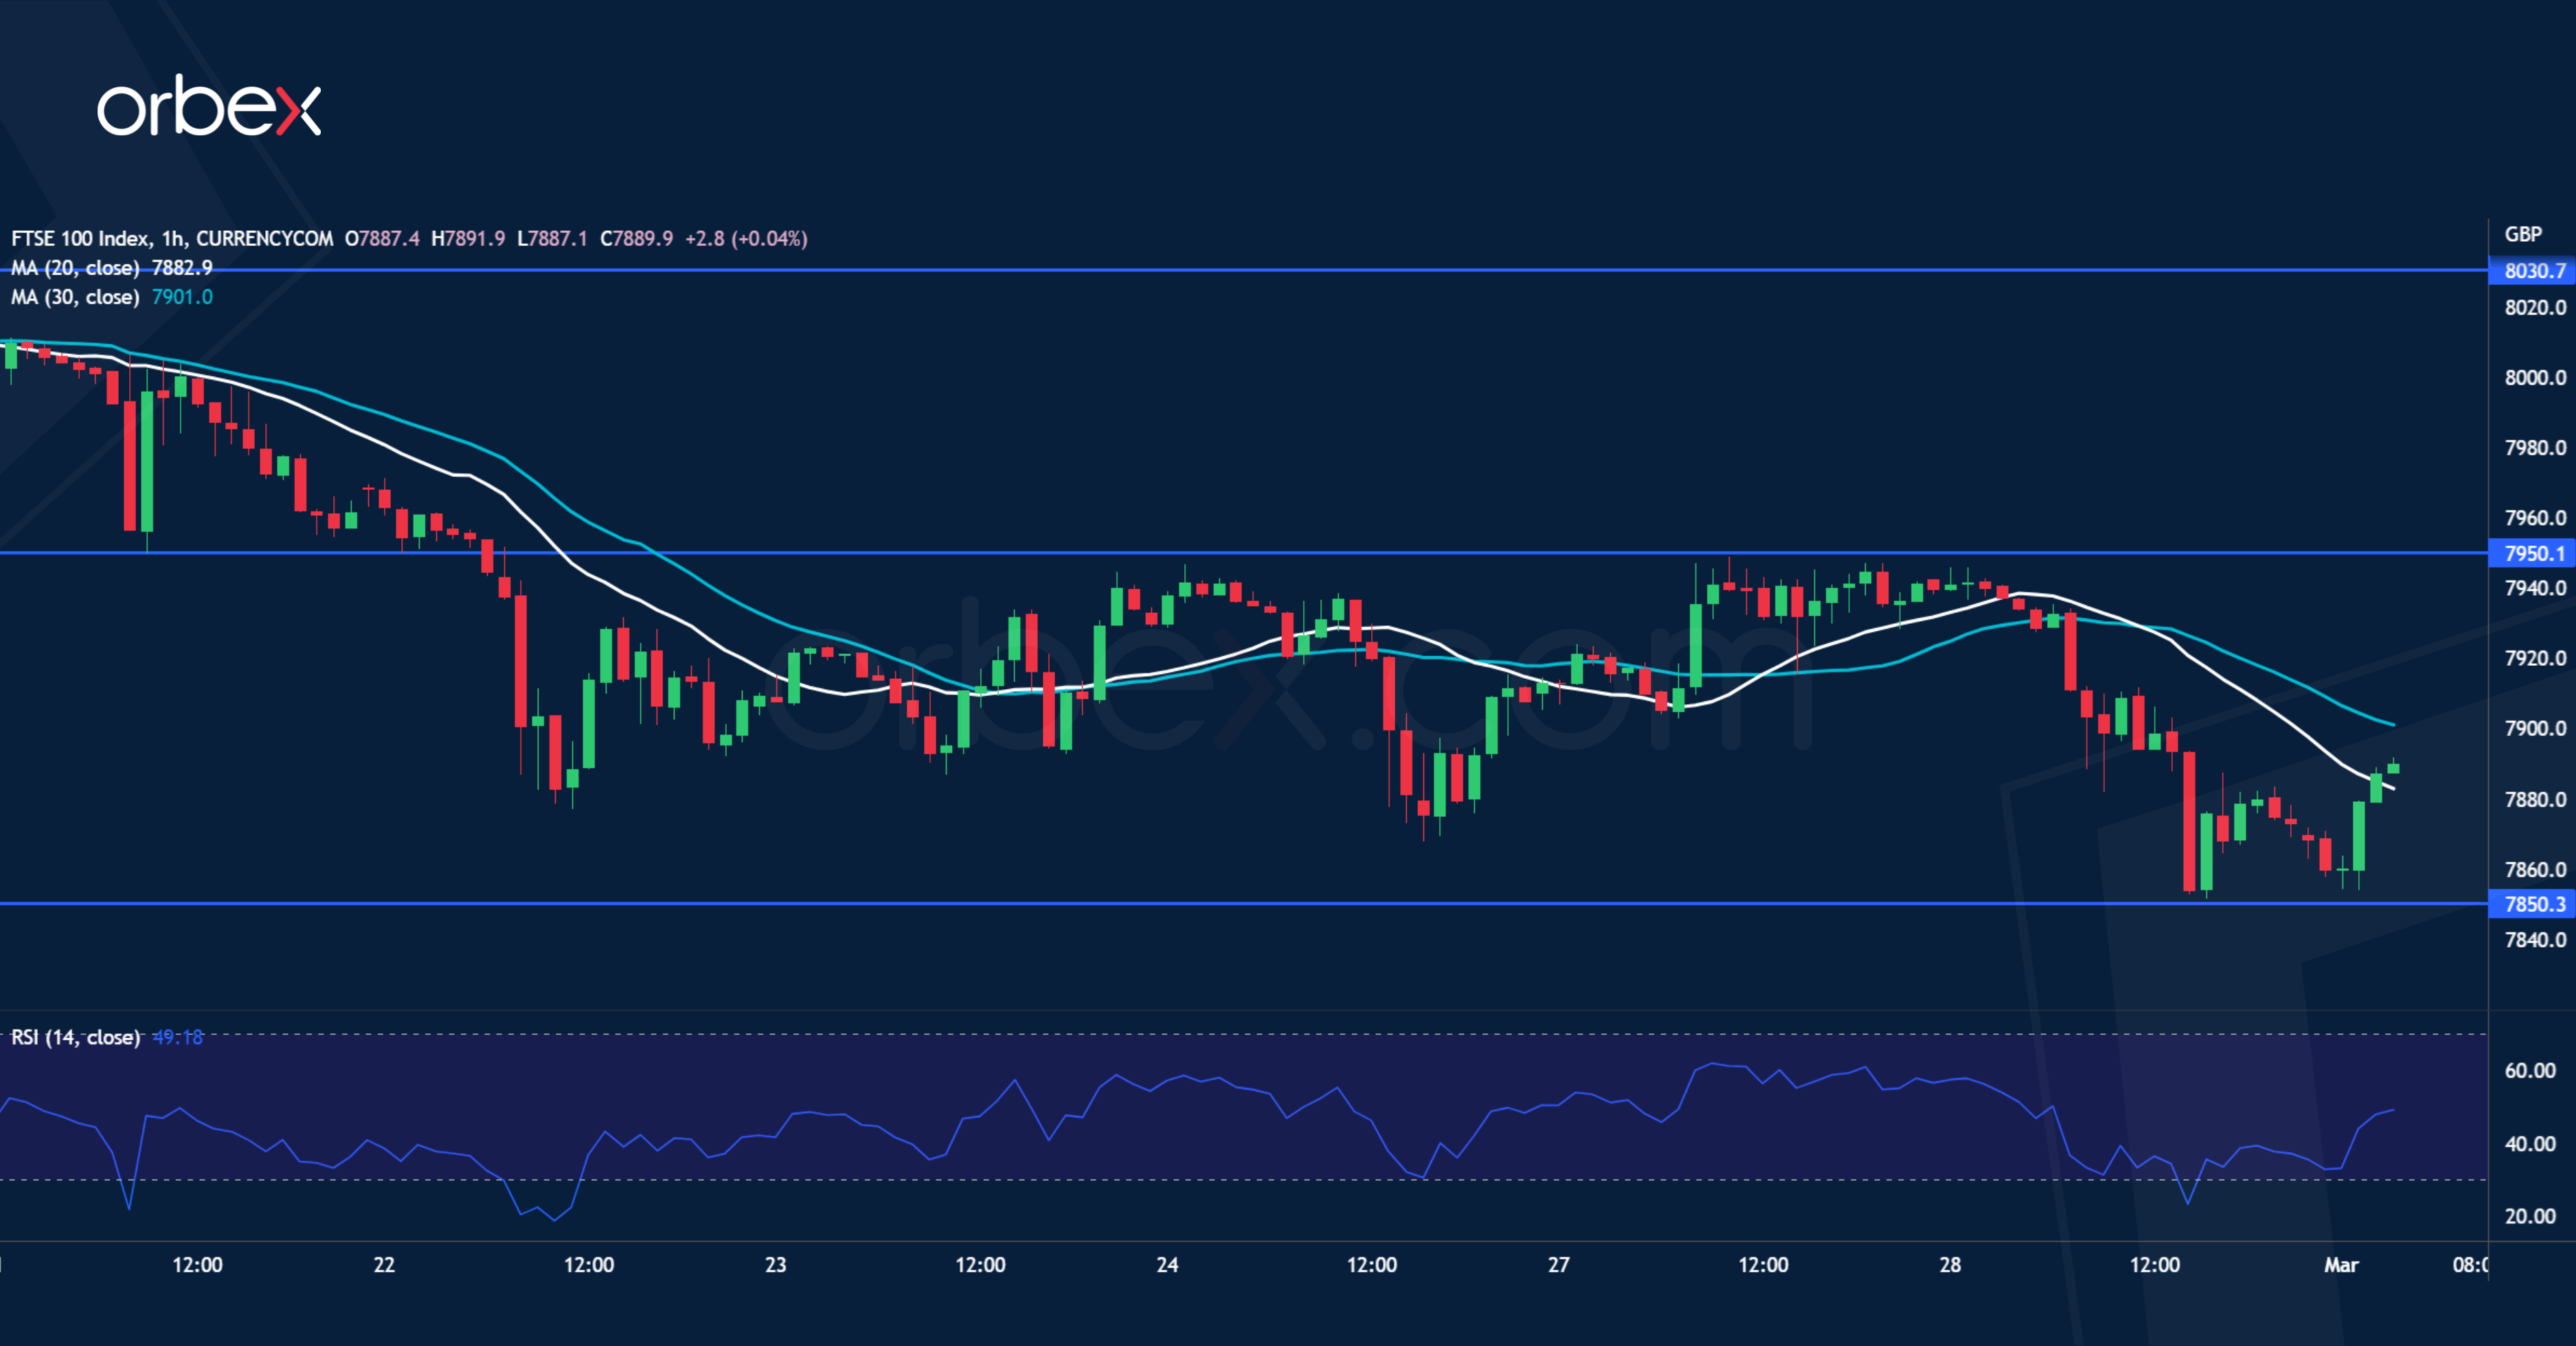
The FTSE 100 tumbles as record high grocery inflation in the UK fans fears of higher interest rates. The index failed to hold on to the 30-day SMA (7870) after hitting resistance at 7950. A correction could be taking shape following a stellar rise since the beginning of the year. The RSI’s oversold condition has brought in some bids but that may not be enough to stage a meaningful recovery in the short-term. Instead, a fall below 7850 may prompt more buyers to bail out, triggering a liquidation towards the daily support at 7710.

![Credit Card 160×600 [EN]](https://assets.iorbex.com/blog/wp-content/uploads/2023/06/13144507/Blog-Banner_EN-Banner_160X600X2.webp)