
On the USDCAD chart, we see that the market is developing a long-term corrective wave (4) of the intermediate degree, which is part of the global downward impulse of the primary degree.
Presumably, the corrective wave (4) is a side wave consisting of minor waves W-X-Y-X-Z. Most likely, the W-X-Y-X sub-waves have already been fully built. Not so long ago, the second intervening wave X was completed, and now the price is rising in the final part of wave (4), that is, in wave Z, taking the form of a minute zigzag.
The growth of the rate in the minor wave Z is possible to 1.314, that is, to the resistance line drawn through the vertices Ⓦ and Ⓩ, this line is marked in green on the chart. Then, upon reaching the specified price level, we can expect a market reversal and the beginning of a decline in bearish impulse (5).

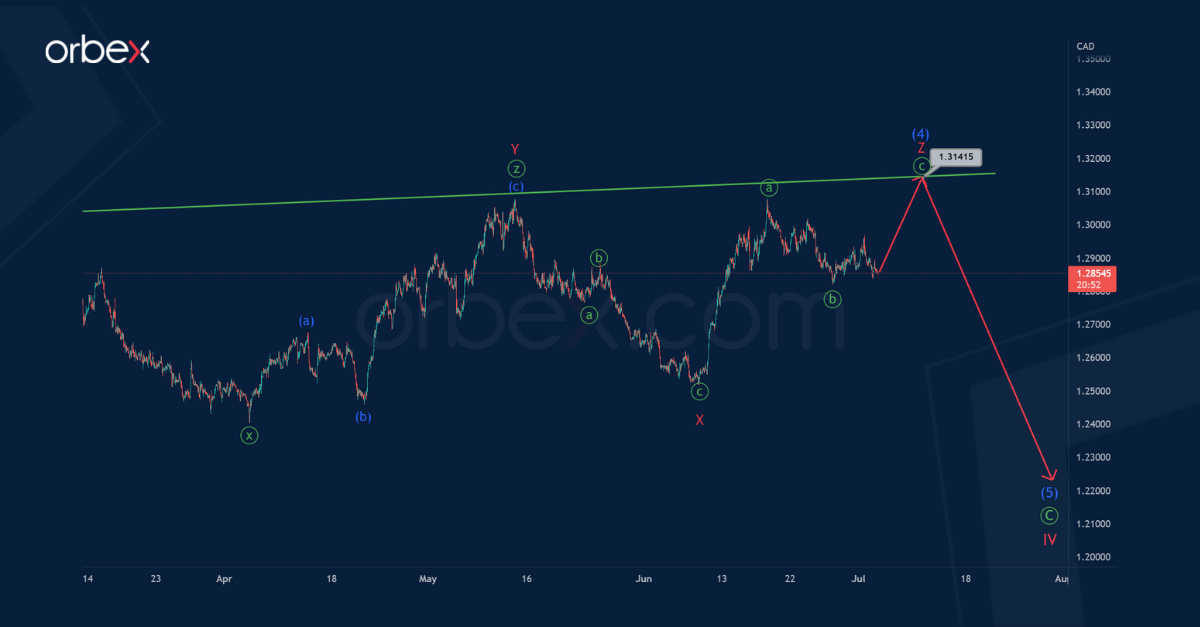
According to the alternative, the formation of the intermediate corrective wave (4) could be fully completed. For this reason, let’s assume that the first sub-waves of the descending intermediate impulse (5) are formed.
It is possible that impulse 1 and bullish correction 2 have been completed today, and now we see a decrease in the minor wave 3, consisting of minute green sub-waves.
The target for bears is at the support level of 1.232, this level is located on the red line drawn through the endings of the descending waves ⓐ and X. At the level of 1.232, a market reversal may occur and the formation of a minor correction 4 may begin.
An approximate scheme of possible future movement is shown on the chart.
Test your strategy on how the US dollar index will fare with Orbex - Open your account now.

![Credit Card 160×600 [EN]](https://assets.iorbex.com/blog/wp-content/uploads/2023/06/13144507/Blog-Banner_EN-Banner_160X600X2.webp)