
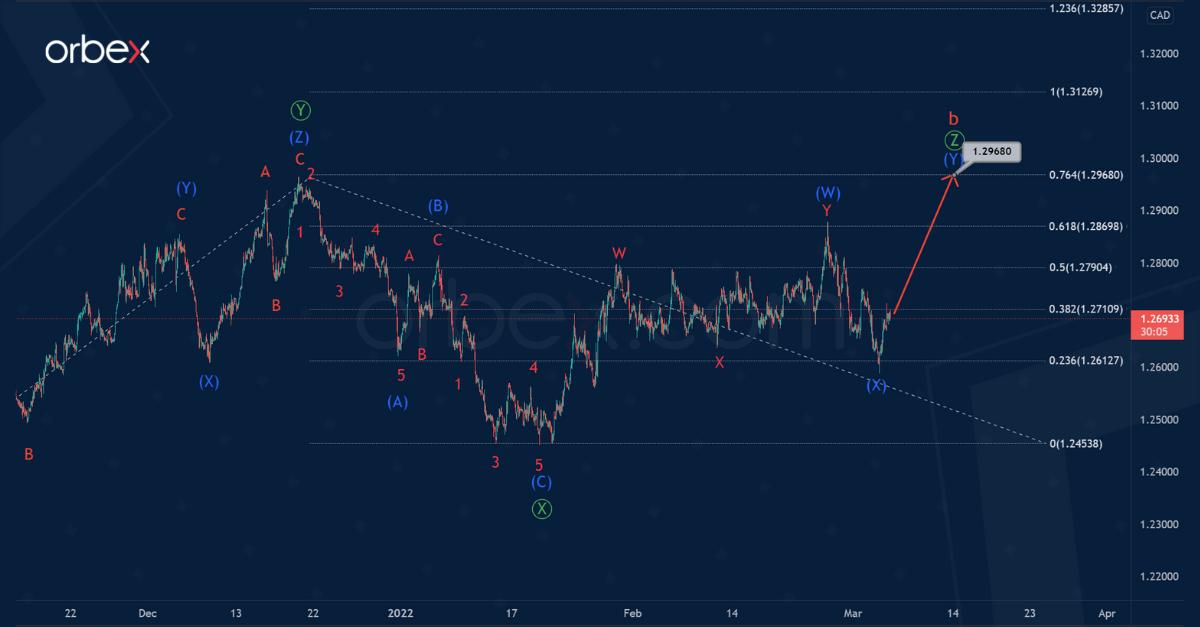
The current structure of the USDCAD indicates the formation of a bullish zigzag Ⓩ. This consists of sub-waves (W)-(X)-(Y) and it’s a double zigzag. Wave Ⓩ is part of the global cycle correction b.
It seems that the intermediate sub-waves (W) and (X) have ended. Thus, in the near future, the pair could start moving towards the 1.296 level within the final wave (Y).
The target is determined using the Fibonacci extension tool. At the specified level, wave Ⓩ will be at 76.4% of actionary wave Ⓨ.

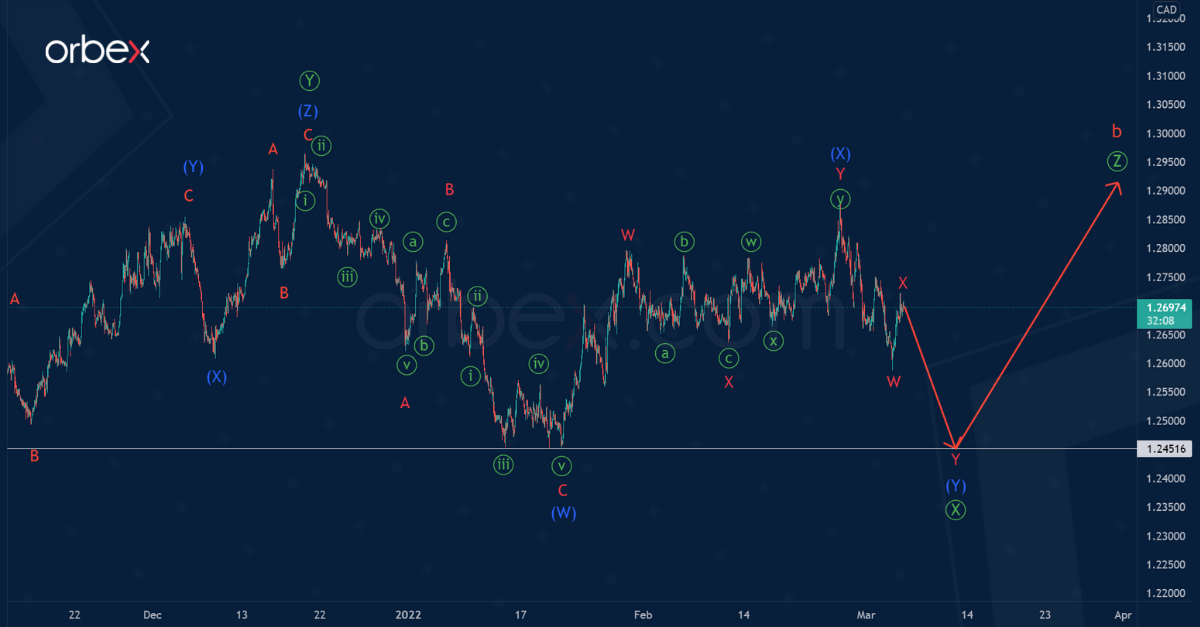
Alternatively, the development of the primary bearish intervening wave Ⓧ is not complete yet. These sub-waves all together make up a bearish double zigzag.
It is possible that (W) and (X) have ended, whilst wave (Y) is still under construction. Specifically, as part of the wave (Y), the minor sub-waves W and X were complete. Thus, in the near future, this could lower the actionary wave Y to the 1.245 area.
The goal is determined by the previous minimum, which was formed by the wave (W). An approximate scheme of possible future movement is shown on the chart.

![Credit Card 160×600 [EN]](https://assets.iorbex.com/blog/wp-content/uploads/2023/06/13144507/Blog-Banner_EN-Banner_160X600X2.webp)