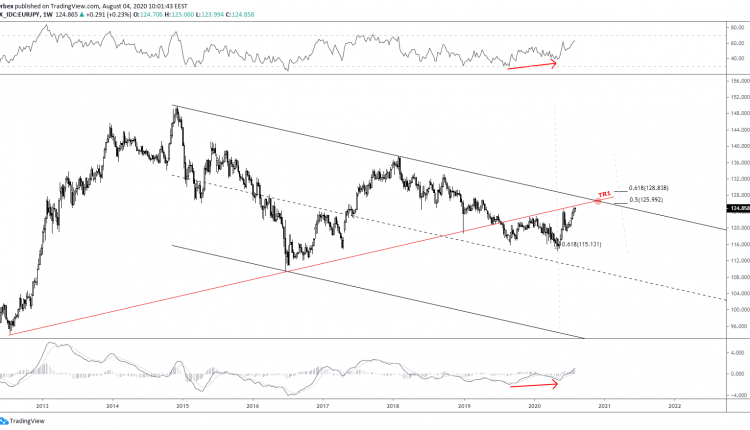
EURJPY maintains a bearish footing in the long-term as prices trade within a descending channel. The move started in Dec ’14 at 149.69 and marked a market low in Jun ’16 at 109.48.
Despite crossing over the median regression of 123.26 in May ’17, bulls haven’t managed to retest the upper channel yet. In addition, the 93.96-109.48 TR1 trendline hasn’t been tested either. Both failures suggest another bullish attempt. Furthermore, both indicators show a bullish hidden divergence.
Closer in, the 61.80% Fibonacci bounce at 115.13 triggered a bullish rally. This came about after a false break below the 115.78 low. Since then, the upside has only been supported by shorter and shorter pullbacks.
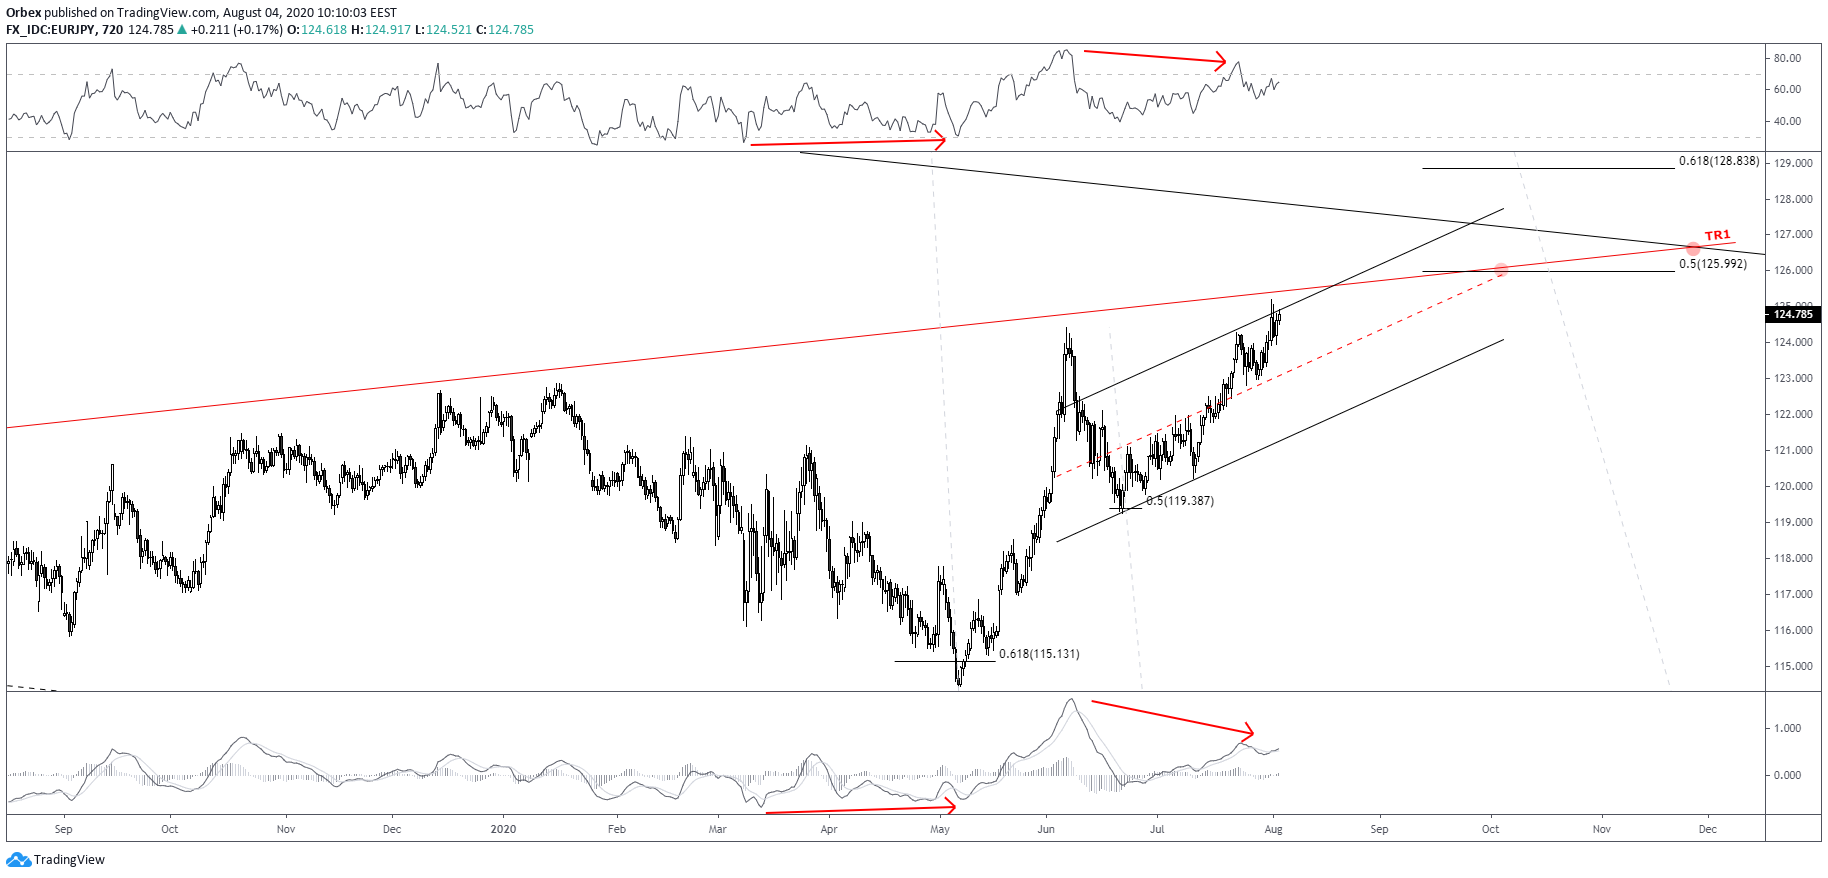

With the last pullback down to 119.38 registering a test of the 50% Fibonacci of the last upside leg, bulls could be in for another spike. This time the TR1 trendline, and perhaps even the upper channel, are likely to be taken out.
The upper channel intersection with the TR1 trendline indicates a confluence near the 126.60 level. This is above the 50% Fibonacci of the long-term bearish leg, however, shy off the 61.80% Fibonacci at 128.83.
Perhaps, bulls will form a false break above the upper channel, miss the golden ratio, and reverse down for fresh lows below 115. In case, however, prices remain outside the channel following a valid bullish breakout, the chances of further upside will increase.
Both indicators are bearish in the short-term. However, the decline could just be another pullback, supporting the medium-term signals shown on the indicators.
Test your strategy on how the euro will fare with Orbex - Open your account now.

