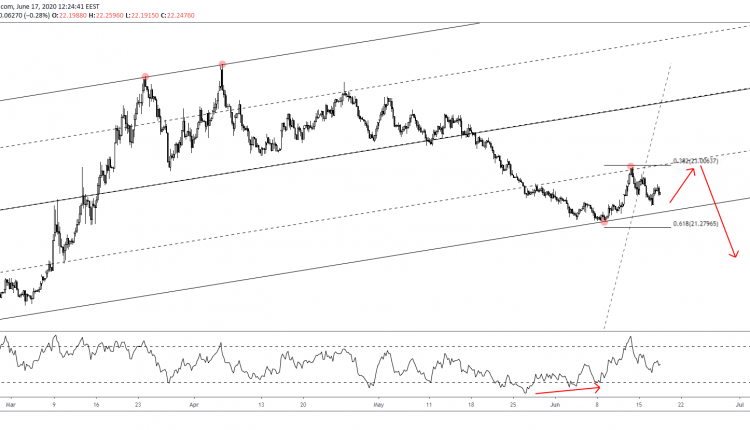
Despite trading with an upside bias, USDMXN’s rejection at the 38.2% Fibonacci could be spelling a shift.
The 23.00 psychological resistance is also where prices meet the median line of the lower regression zone. This makes the intersection a strong confluence level.
When taking into account the weak bearish attempt to take out the 61.80% Fibonacci at 21.279, chances to revisit the support level are good. This can come after a weak bullish attempt towards the 23.00 level or before.
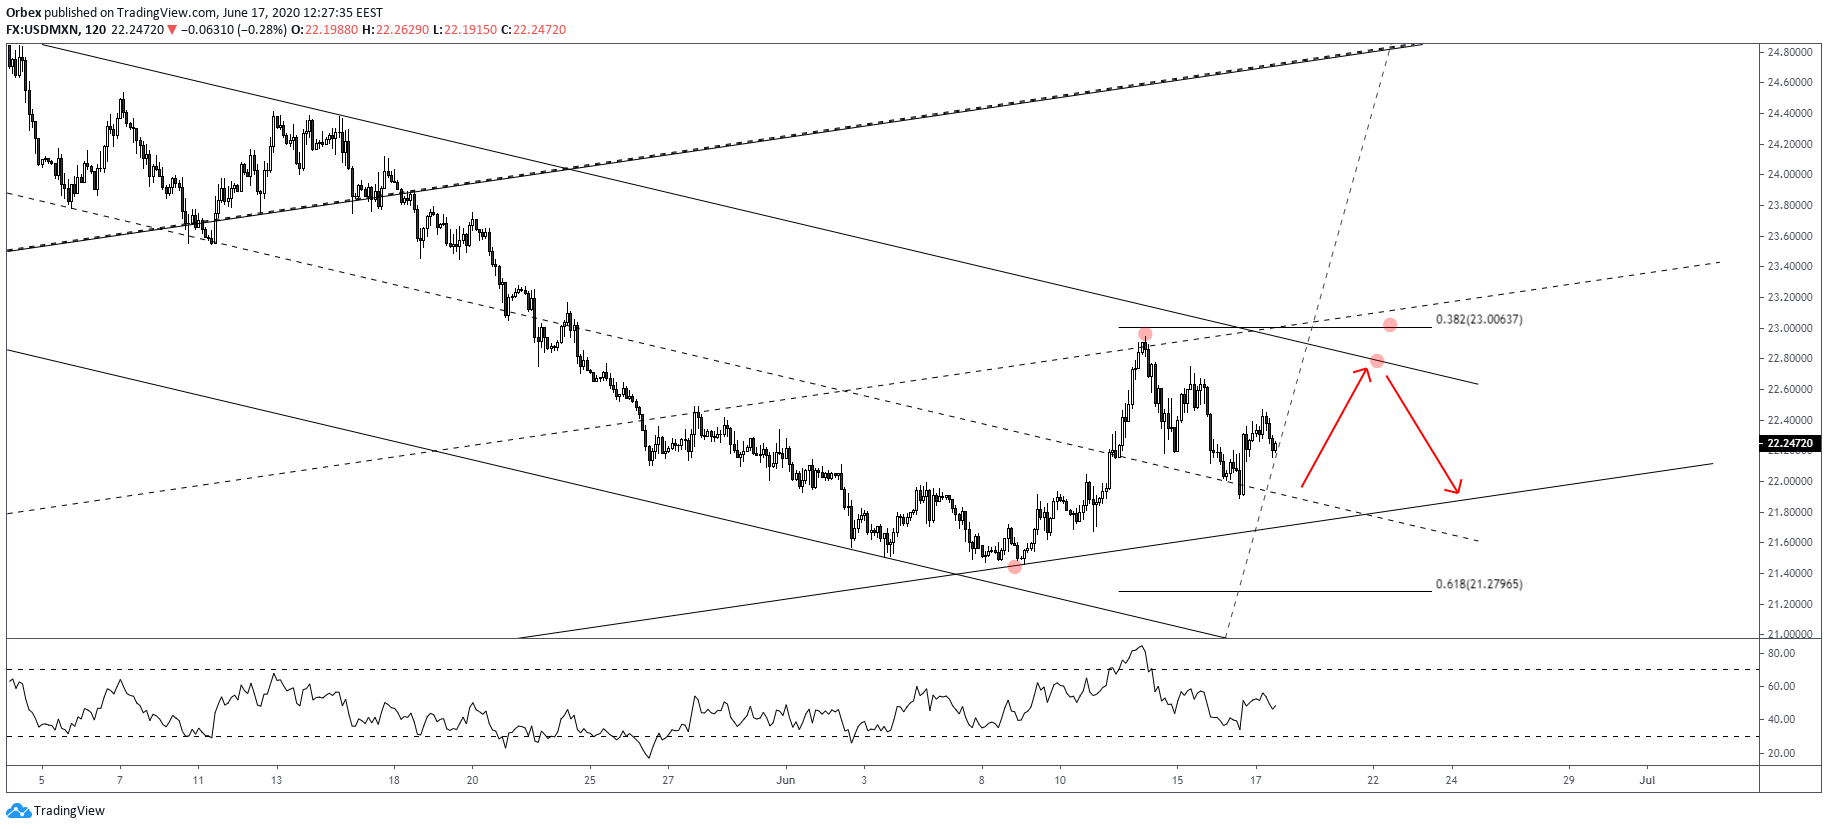

The 2H chart above shows that the pair trades in a descending channel in the shorter-term. With the median line having repelled bears, we could see the said bullish attempt coming into effect. However, bulls could see a rejection at the upper channel near 22.80. If not, a fresh high can be expected.
In case prices break below the median line prior to moving up though, this would suggest a decline towards the 21.279. This will require a break outside the ascending channel first.
Revisiting the golden ratio will increase the chances of further downside, trading above the median regression line of the ascending channel will most likely invalidate the idea.
Have you been testing your strategy on a Demo Account? Sign up now and begin practicing!

