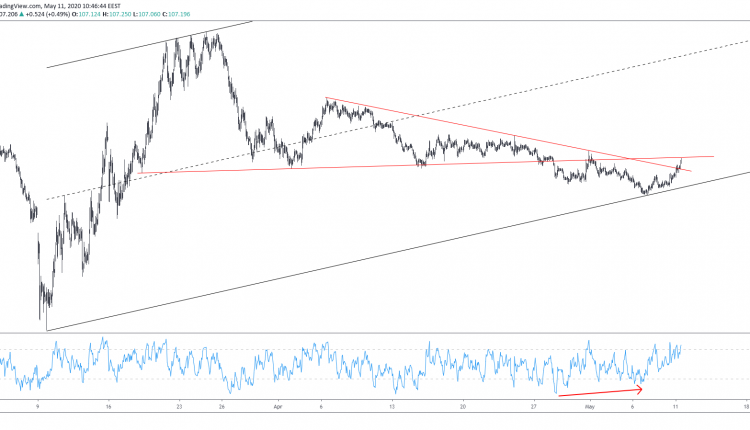
Price action on USDJPY has been bullish since the 106.00 takeover on May 07.
One swing low at 106.25 and one at 106.75 have both supported the upside initiative since. The latter, followed by a break above the descending trendline starting Apr 06, looks promising. Not only does it carry high momentum but it is also supported by an RSI (9) divergence on the 1-hour chart (as seen above).
Despite being promising, the rise isn’t going to be linear.
Currently, above the round 107.00, bulls are eyeing the 107.32 resistance; the intersection where price meets the ascending trendline starting Mar 18.

However, they could have either already made or still make, a weak attempt initially.
So, we could expect a pullback even at lower than the 107.00 level.
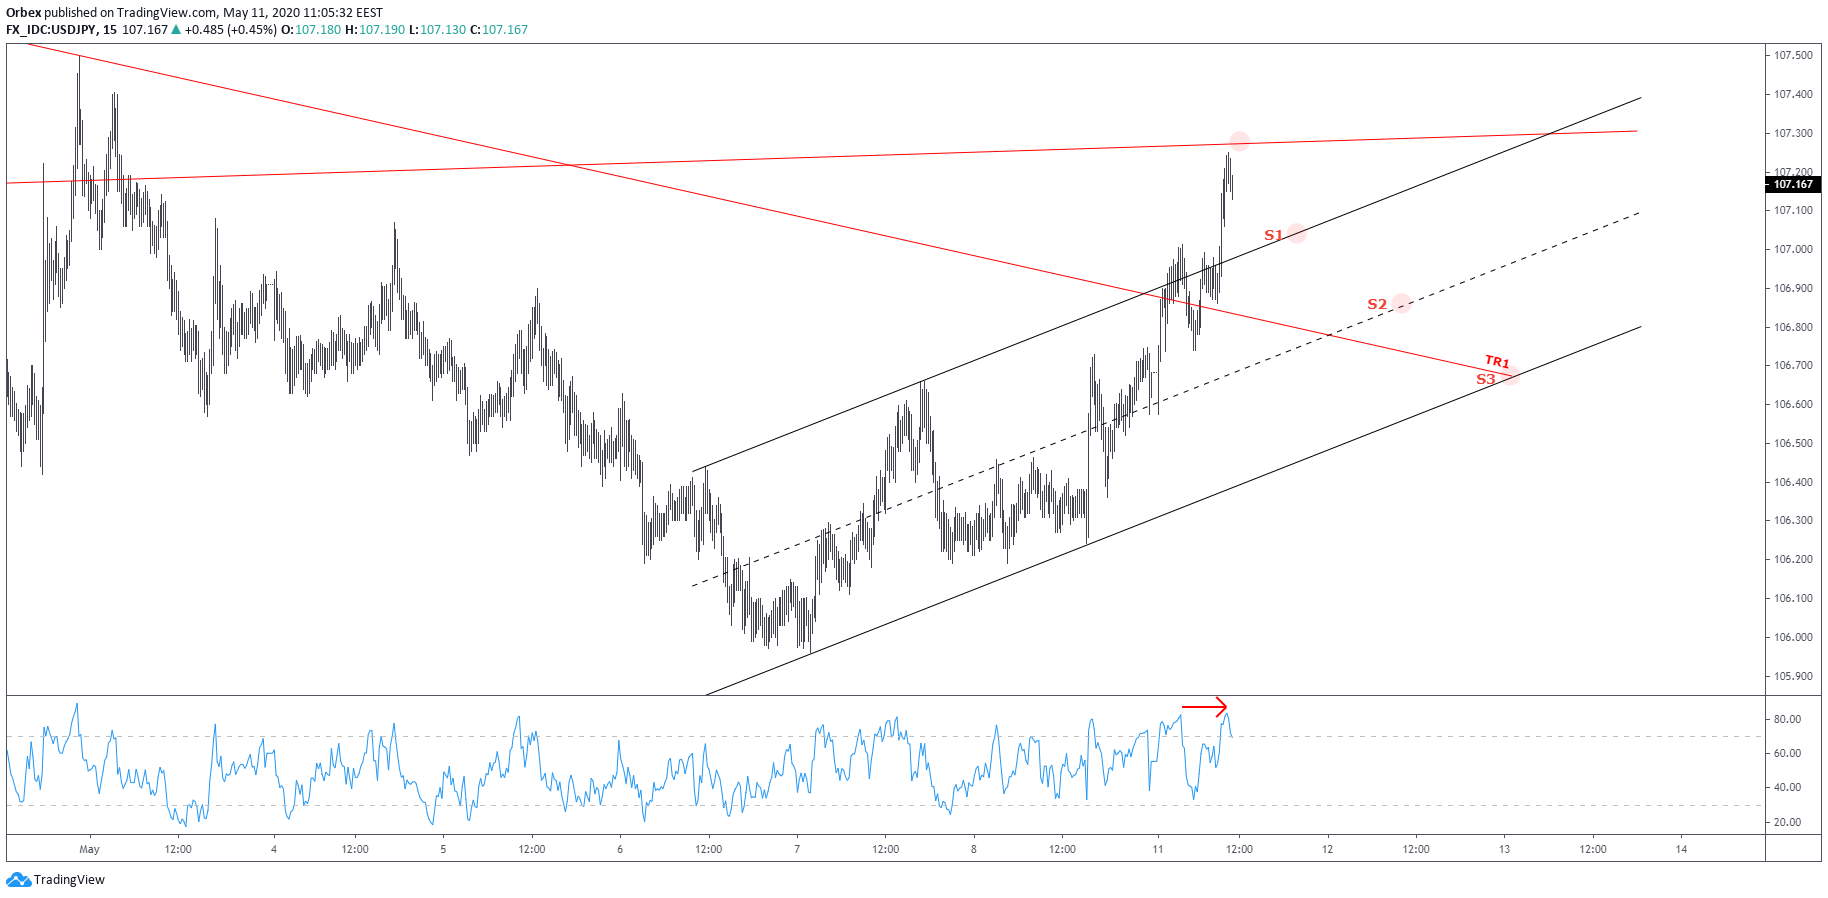
The 15-minute chart above takes a closer look at the short-term action, where different pattern projections can be identified.
For one, prices broke outside the ascending channel starting May 07, which is seen as a bullish sign. Secondly, a false-break occurred initially, which increases the probabilities of further continuation up. And finally, bulls maintain prices above the descending trendline (TR1) as well as the 107.00 psychological level.
That being said, we are in the early stages of the breakout, which means we are not confident it will be sustained.
Bulls will likely sell some of their trades for partial profits and recapitulate once more supporting volumes come through. This could bring prices near 108.00. This makes a better region for further confirmations once bullish sentiment improves. However, it is unlikely to occur without a pullback.
A pullback can occur either with a test of the 107.32 top or without. Once confirmed closer to or below 107.00, we could expect a continuation to take prices higher. Now, the pullback can bring prices down to S1, S2 or even S3 – where S1 is the intersection of price-channel (top), S2 of price-regression line, and S3 of price-channel (bottom). An alternative is a test anywhere on the descending trendline (TR1).
With the RSI ‘somewhat’ rather than ‘fully’ supporting prices with a downside bias, it would be no surprise if we see fresh highs above 107.32 before shifting into a pullback mode.
We can assume that the bullish narrative is invalid below the ascending channel. Once broken, we could expect fresh lows. This means that USDJPY’s short/medium-term performance depends on how deep the pullback will be.

