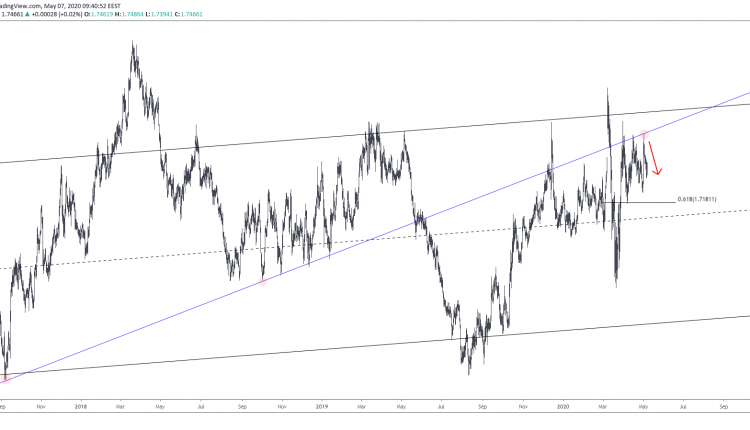
Starting Jan 15, 2017, GBPCAD has traded within the positive region of the ascending channel.
Numerous attempts to penetrate the ascending trendline starting Sep 06, 2017, have failed. Bears have proven to be stronger than bulls recently.
However, prices have traded above the 61.80% Fibonacci retracement of the 1.4840-2.0969 bull move since the Apr 07, 2020 test of 1.71811. This alone spells a different story as it looks in the medium-term to draw conclusions.
In addition, the most recent declines appearing on the 1-hour chart below look corrective. The bear market starting May 01 drifted down to near the 1.74 round support. This could mean a bullish reversal is in the making.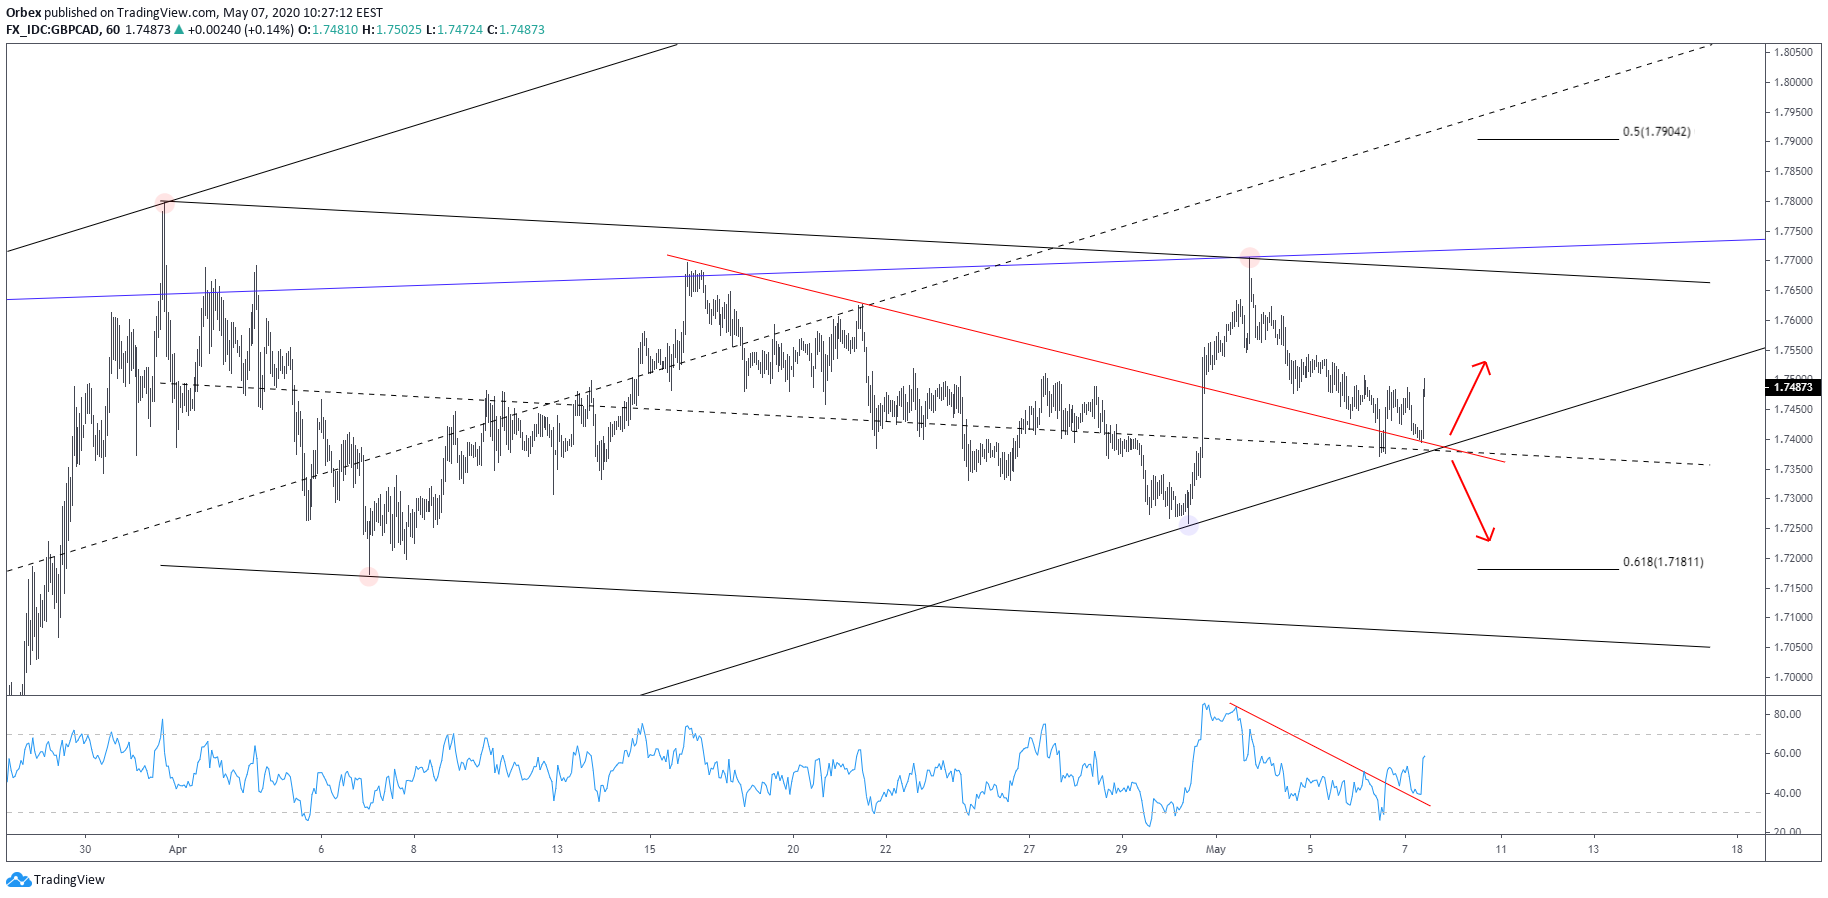 Not only is the region highly active but there are several confluence components pointing at very strong support. These include the ascending channel starting Mar 20, the descending trendline (highlighted in red) starting Apr 15, and also the regression line of the shorter-term descending channel starting Mar 31.

If prices remain biased to the upside above the confluence level, chances of GBPCAD reaching the top of the descending channel will increase. That is near the 1.7650 level. However, multiple resistances will have to give in first, with a strong one laying at the 1.7567 level.
In case prices break below the confluence level, we could still expect the former to occur. Only if the 1.7358 support gets broken down we can expect bulls to be invalidated. A break of the said support could lead us to fresh lows. This may even include the golden ratio level at 1.71811.
Note, however, that the recent moves from the 1.7370 lows are looking impulsive. On top of that, the RSI trendline break is indeed signaling a potential reversal followed by a continuation to new overbought levels first.

