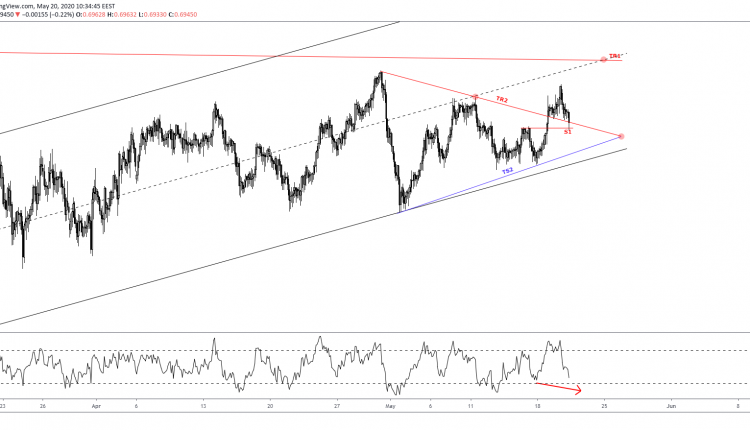
The 2-hour chart of CADCHF shows that the pair has been trading within an ascending channel since March 19.
Despite trading within the lower end of the regression channel, it remains above the trendline resistance TR1 (now support). And this alone suggests more upside.
In case both TR1 and S1 support levels reject bears, prices could extend to fresh highs above the 70 big figure; a strong confluence level lays near 0.7050, where the regression line and the longer-term TR1 trendline intersect.
The 1-hour chart below shows the shorter-term channel intersecting 0.7050 too, adding firmness on the said level.

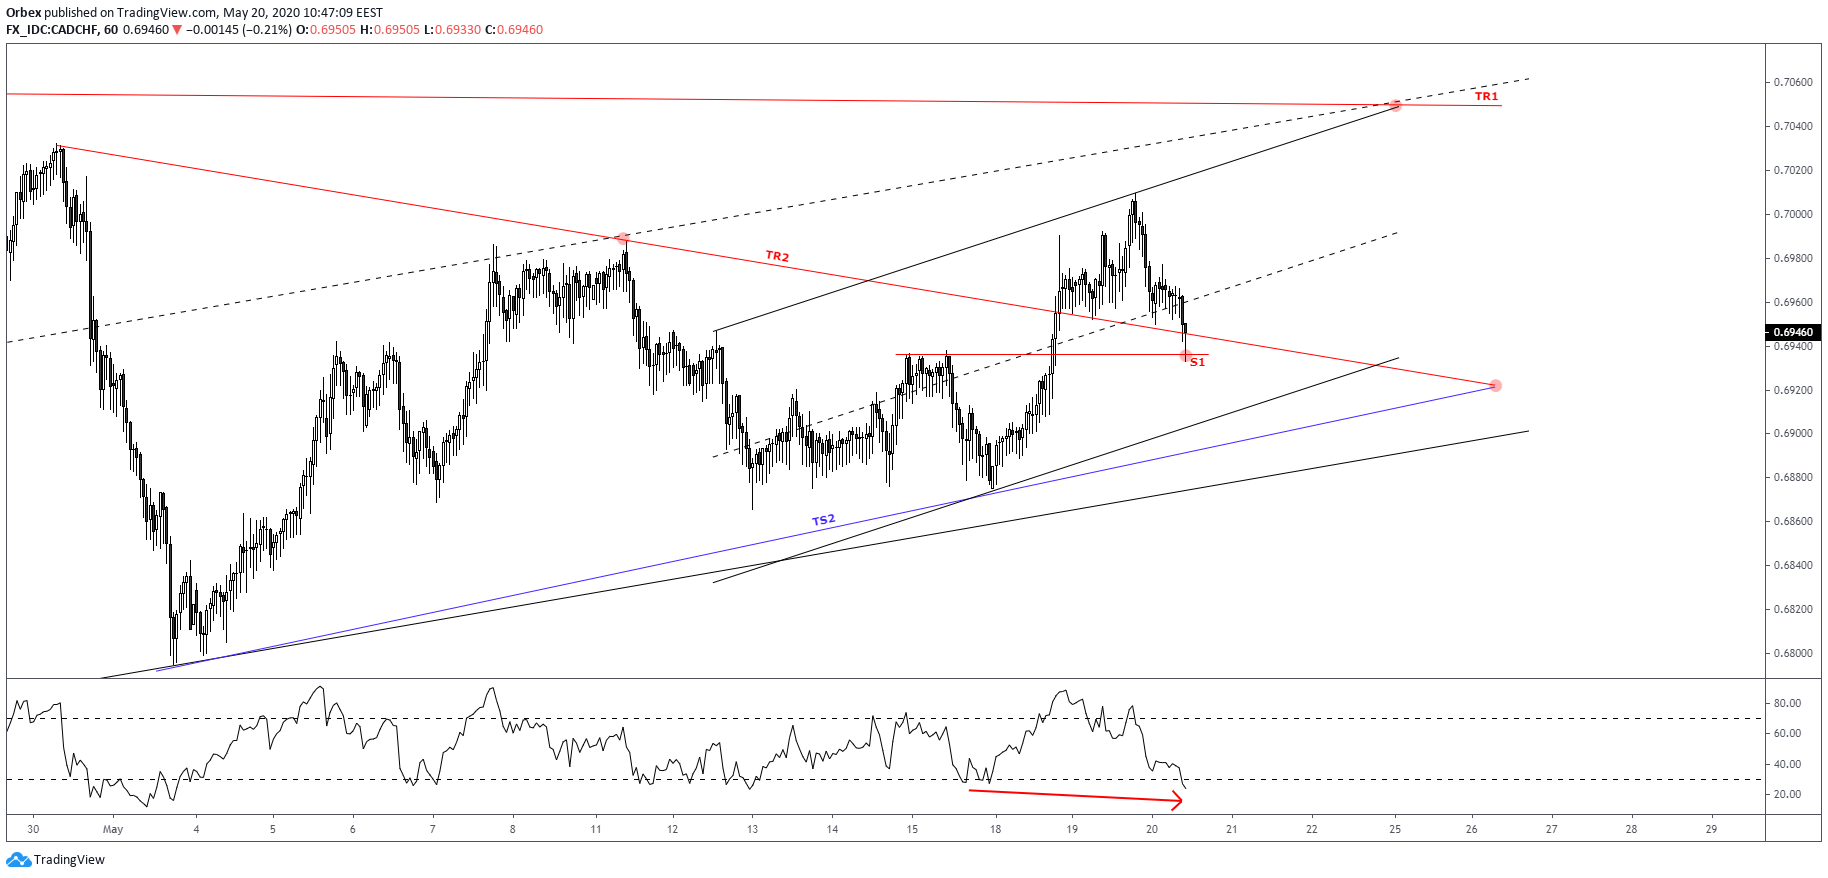
That said, the RSI (9) shows a bullish divergence signal too. With TR1 and S2 firm, this combination increases the chances of moving higher without pulling back towards TS2 or the lower channel below 69.
Looking at upwards targets, we can mark the test of the regression line of the shorter-term ascending channel first. Then, look at the upper channel above 70, and last the TR1 confluence near 0.7050.
In either case, a decline near 0.6922 or near the 69 round support could be seen regardless. This would form a bullish divergence on the 2-hour chart as well, making a stronger case compared to the shorter-term RSI divergence seen on the 1-hour chart.
Join our responsible trading community - Open your Orbex account now!

