As we discussed last week and as we can see from our previous chart:
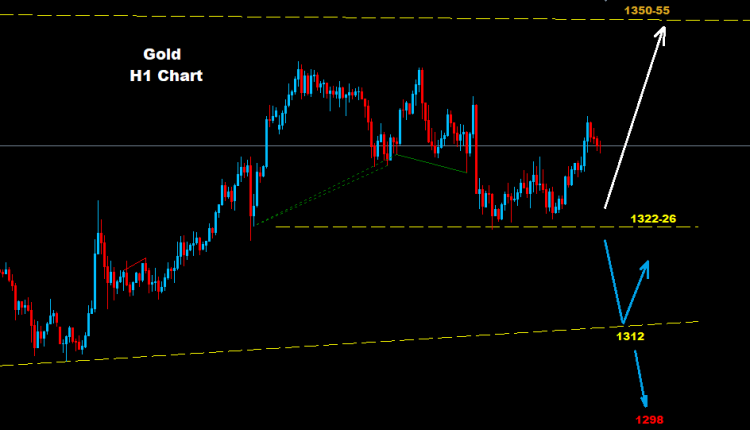
Gold managed to hold trading above the support zone 1322-26 where, as long as the market keeps trading above this zone, further advances to test the 1350-55 zone are expected.
Below the 1322 point a further drop may hit the market towards the 1310 point, even going as far as 1300.
As we can see from the chart zone of 1350-55 it is possible that another drop correction wave will occur, while above the 1355 point further advances towards 1375 are expected.

| Support | Resistance | |
| Level 1 | 1322-26 | 1341 |
| Level 2 | 1312 | 1350-55 |
| Level 3 | 1298 | 1370-75 |

