
A price chart is probably the most important piece to the puzzle when it comes to trading the financial markets. While fundamentals drive the price of the instrument, without a price chart to look at, it would be a herculean task to trade the financial markets.
Ask any trader about the price chart that they use, and the most common response would be the candlestick chart or the bar chart. Some might even refer to the Heikin Ashi chart. The line chart is most often ignored or least used by day traders.
However, looking beyond the surface, there are quite a few chart types that are very unique. In fact, these chart types have a common denominator, which is the fact that time is excluded. These “time-independent charts” or pure price charts offer a completely different view of the markets.
The three time-independent chart types

The three most commonly used time-independent chart types are:
- Renko Charts
- Kagi Charts
- Range bars
Let’s explore each of these unique chart types.
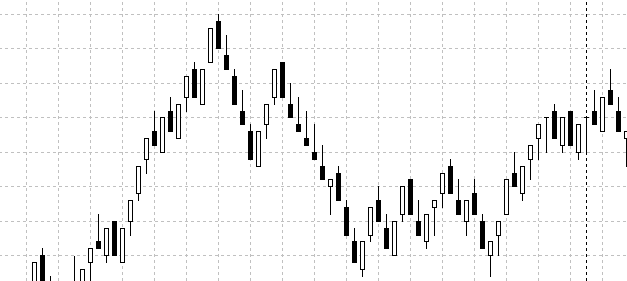
Renko Charts
Renko charts are visually distinctive from all other chart types. Coming from the Japanese word, Renga or brick, the Renko charts are brick type charts that print a new bullish or a bearish brick depending on the number of pips price moves.
The chart below shows a 25 pip EURUSD Renko chart.
When looking at the Renko chart, the only aspect to consider is the price plotted on the y-axis. Based on the number of pips that each brick is set for, you can expect to see a new bullish Renko brick being printed when price moves ‘x’ pips in the same direction.
A reversal Renko is plotted when price moves two times the ‘x’ pips in the opposite direction. Therefore, every ‘x’ pip move in the bearish direction prints a new bearish Renko.
Many technical analysts look at this unique chart type as a means to analyze pure price action. It is often said that noise that is prevalent in most of the time-based charts is absent. However, you can still see some sideways range being shown on the Renko chart as well.
Kagi Charts
Kagi charts are also based only on price and are independent of time. These charts stand out as vertical lines colored based on bullish or bearish price action with a connection to each of these vertical lines.
The next chart below shows an example of a Kagi chart.
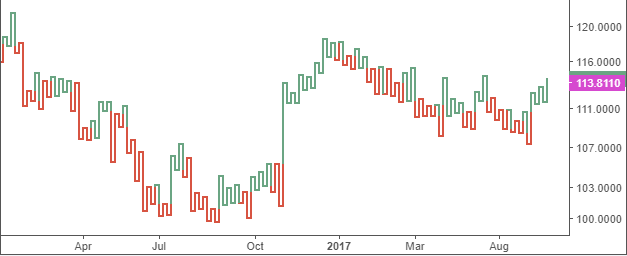
The name Kagi is the Japanese word for a wood block and is based on the ‘key’ or the L-shaped tool used to align paper or to align sharp edges. Kagi charts are therefore also referred to as key charts. Another reference is the yin and the yang lines.
The yin line is when price action is bearish, and the yang line is where price action is bullish.
When price moves at a user-defined level, the bullish or bearish Kagi’s are formed. However, when price exceeds this user-defined level in the opposite direction, a horizontal line is plotted followed by a new reversal bullish or a bearish Kagi.
Kagi charts are probably the easiest of chart types to interpret price action. With the Kagi charts, price action needs to undergo a significant change of direction in order to print a new reversal Kagi.
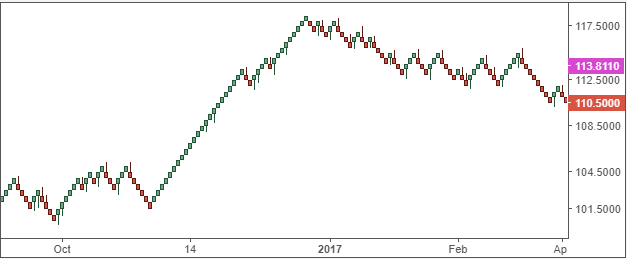
Range bars
Range bars, unlike Renko or Kagi charts, are a product of the Brazilian trader Vicente Nicolellis. Range bars were developed in the mid-90’s and are relatively new considered to the ancient Renko and Kagi charts.
However, despite the uniqueness, range bars also take price into consideration and remain independent of time. Each range bar represents a specified price movement. Range bars follow three simple rules.
- Each range bar has a high and low that is equal to the range specified by the user
- A new range bar opens when price moves above the specified level
- A range bar closes at the previous high or the low
The chart below shows an example of a range bar.
What you can see is that Range bars look in some aspect to be similar to the Renko charts. However, that is where the similarity ends. With range bars, every bar is equal in range.
Range bars were designed by Nicolellis for the specific purpose of trading volatility. Thus, ranging price action can be easily identified when using this chart type.
Besides the above, other unique chart types include the Point and Figure Chart and the three line break chart. In the next section of this article, we will explore in more detail about each of these chart types and the information they offer for day traders.

