
Price action trading can be one of the simplest ways to trade the markets. Although indicators tend to offer some perspective, experienced traders will no doubt keep coming back to the most classic methods of technical analysis.
Support and resistance levels, along with trend lines can most often than not give enough information for the trader. This means that traders can simply apply these concepts and prepare for potential trading opportunities.
One of the pitfalls of trading these methods using the conventional chart types is the fact that price is prone to a lot of noise. Getting a unique concept of the markets can certainly give the trader more confidence in their trades.
What are Range Bars? Trading strategies using the Range bar

The range bars, which we covered in the article previously allows traders to view the same price chart differently. With time removed from the equation, traders can look at the range bars to understand when prices are moving flat or sideways and when a trend is taking shape.
After all, no matter what trading strategy you use, the bottom line is that traders want to know and with confidence when to enter and trade, and when to stay out when the markets are trading sideways.
The range bars, due to their unique model of displaying price makes for a perfect chart type that can be used with horizontal support and resistance levels and combine this information with trend lines as well.
Plotting support and resistance levels on the range bars
As you might already know, with range bars, the high and low are the most important aspects in the chart. This means that any potential support or resistance levels that you want to plot can be done either at the high or the low of the range bars.
In the first example, you can see a very simple illustration of how we plot support and resistance levels.
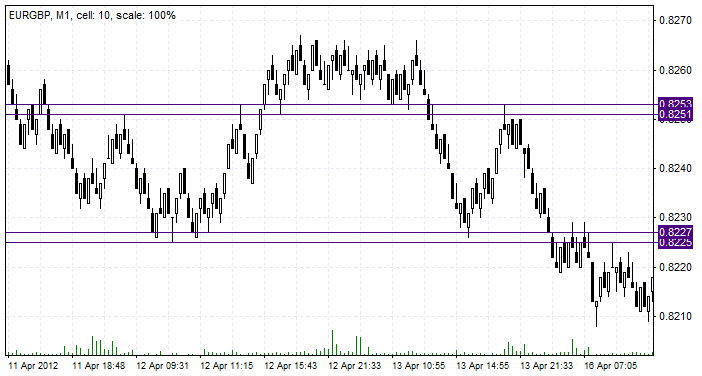
Starting from the left, you can see an area of consolidation where prices closed and posted lows as well. Thus, taking a price area near the lows, we have plotted the support levels.
Similarly, to the upside, we have another area where resistance is plotted. Here too, you can see that the resistance area has been formed after price initially failed to break the level, and after breaking this level we had a period of consolidation near the top.
When the support and resistance levels formed, we can then see that price eventually breaks out from the resistance turned support level at the top and price declines sharply to the lower support that was identified.
For traders, this is a perfect opportunity to enter short positions here as price retraces back to the resistance level and reverses from there.
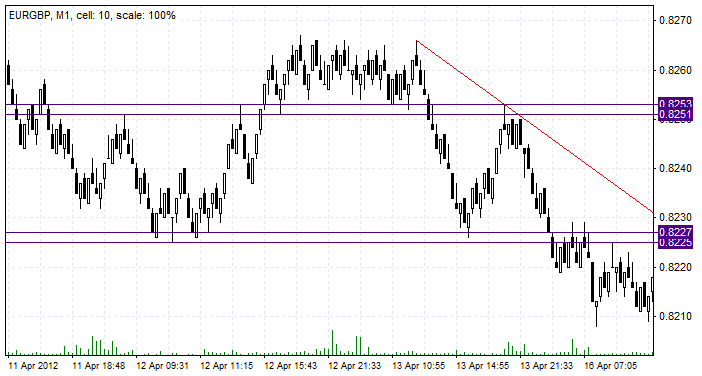
Once again, the sharp declines send price back to the previous support level. If this trading opportunity wasn’t enough, you could also combine trend lines to the equation.
The next chart below shows the trend line that is now plotted. With the trend line set up, traders can now wait for an opportunity for this trend line to be breached in order to take a long position again.
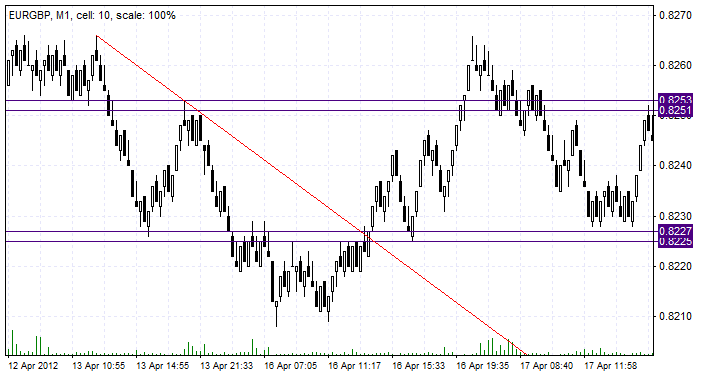
A few sessions later, we can see that price breaks the trend line to the upside and quickly dips back to the familiar support level. With the resistance level already identified, long position on the pullback gives another opportunity to day trade the markets.
The above examples illustrate how traders can use simple methods of technical analysis and apply this to the range bars. Due to the unique structure and set up of the range bars, traders who are inclined to use price action trading methods will find it very enjoyable to trade with range bars.

