The doji candlestick pattern is one of the simplest and easiest of all variations of the Japanese candlestick patterns to identify when doing technical analysis. While Forex traders often tend to pay a lot of attention to other more complex candlestick patterns, mastering the “doji” and understanding it’s significant in a trend is, in fact, all that you need.
The doji candlestick pattern can be misunderstood when reading it in isolation as there are several existing Japanese candlestick patterns that can cloud the validity of your technical analysis. However, when you combine other aspects of Forex trading such as the market trend, the fundamentals, and even your favorite MT4 indicators, doji candlestick patterns can help you to not only understand what was happening with the market but more importantly, what could happen in the future.
The Doji Candlestick Pattern
The doji candlestick pattern is one among many Japanese candlestick patterns. But it is significant in technical analysis because this single price pattern can tell you a lot about the market structure than using a two or even a three candlestick pattern.

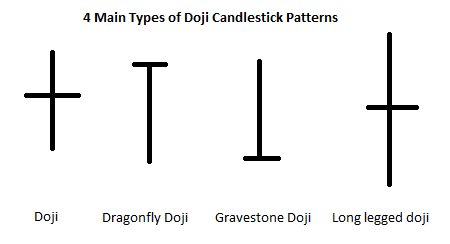
The doji candlestick pattern visually stands out from the rest of the Japanese candlestick patterns. It is marked by the open and close prices, and when those form some distinctive highs and lows. There are different types of doji candlestick patterns doji candlestick types of course:
- the doji
- long-legged doji
- gravestone doji
- dragonfly doji
There are other variations as well to the doji patterns, but all the variations look more or less the same. And its purpose is the same:
Depending on the asset that you are performing technical analysis on, you may or may not see a textbook doji candlestick pattern (where open = close). For example, a cursory check on EURUSD from January 01, 2016 to date shows only two instances where the daily price closed in a perfect doji pattern (open = close). Therefore, when looking for the doji pattern, traders need to allow some flexibility in their technical analysis.
Understanding The Market Sentiment With The Doji
As you might have already heard, the doji candlestick pattern signals show indecision in the markets, meaning that neither buyers or sellers are willing to push prices further, despite the intraday session posting a high and low from the open. This typically signals that FX traders are awaiting further clues on the fundamentals.
When a doji candlestick pattern appears, it simply means that there is a temporary pause in the prevailing trend. Price can continue to push higher or lower forming more doji candlesticks. Therefore, whenever a doji candlestick appears, traders should be cautious for a potential shift in the sentiment, sooner or later.
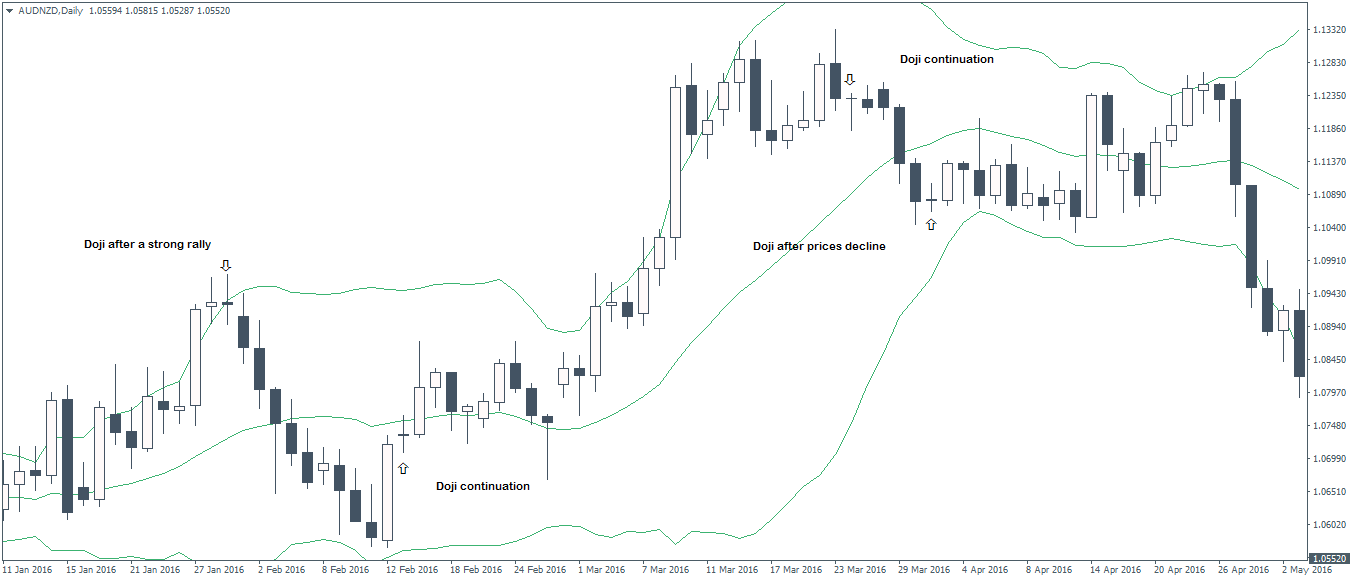
In the chart below we use simple technical analysis to identify some of the doji candlestick patterns. Each tell a story when used within the market context:
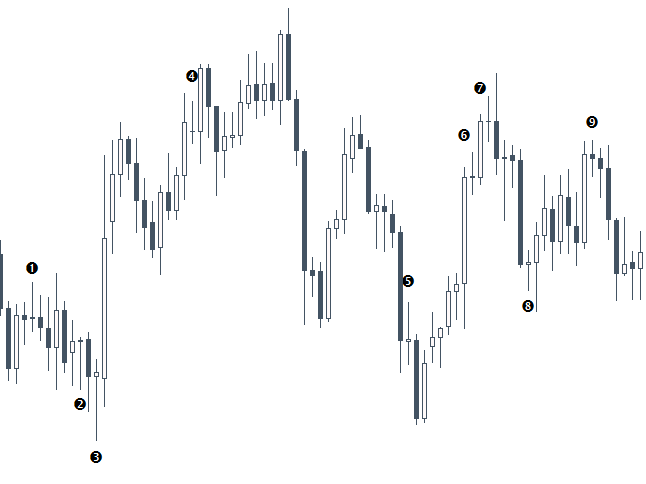
- This doji appeared within a previous downtrend. Following the close below the doji’s low two sessions later, price continued to push lower
- Here, a long-legged doji was formed, but the next session closed bearish resulting in a new lower low forming
- Another long-legged doji followed by a strong bullish candlestick pattern indicating upside momentum
- Doji formed after the pullback to the previous uptrend. A bullish close above the doji signaled further upside
- A doji coming off a bearish candlestick and another bearish session indicated that sellers were in control
- A bullish close above the doji high saw prices posting a new local high
- Another doji after the bullish Japanese candlestick pattern but prices closed lower despite a new high forming, indicating a shift in trend
- Doji after a strong bearish candlestick pattern followed by a bullish close triggers near-term upside in prices
- Doji, after a local rally, sees prices subsequently pushing lower
Trading The Doji Candlestick Pattern
The easiest way to practice trading with the doji candlestick pattern is to look for the following pattern when you do your usual technical analysis:
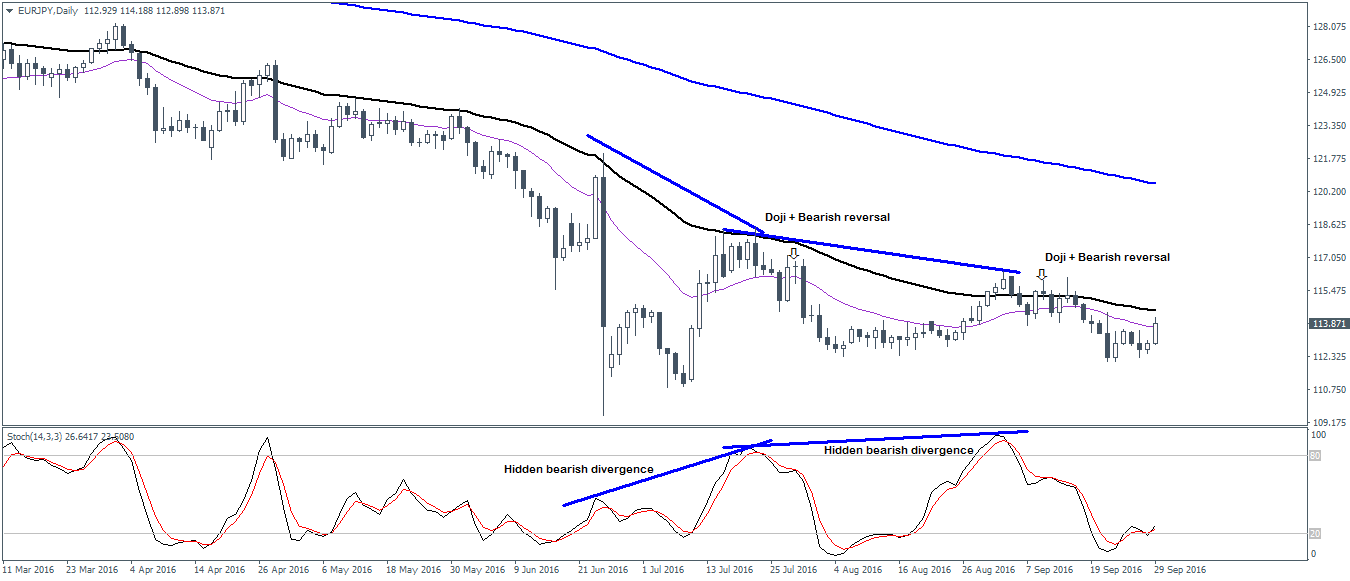
For a sell scenario, look for a previous strong uptrend (more significant if this uptrend is marked by strong bullish Japanese candlesticks). Look for price to make a doji candlestick pattern at the top followed by a bearish candlestick close below the doji’s low. (Ideally, this reversal candlestick should have a lower high than the doji’s high).
The opposite holds true for a buy scenario. Wait for a strong downtrend followed by a doji and a bullish close above the doji high.
These rules can be further validated by any of your favorite technical indicators; Bollinger Bands, moving averages, PSAR, etc. And all have the ability to improve your technical analysis, especially when combined with one of the several Japanese candlestick patterns.

![Credit Card 160×600 [EN]](https://assets.iorbex.com/blog/wp-content/uploads/2023/06/13144507/Blog-Banner_EN-Banner_160X600X2.webp)