USDJPY (102.13): Overall, the long-term trend remains to the upside after USDJPY broke out from the descending wedge pattern. Last Friday after Janet Yellen’s speech at Jackson Hole. Resistance is seen at 102.50 – 103.00, which was briefly tested around August 1 and later around August 8. Further upside towards 104.00 is expected if the price is supported by the fundamentals. Currently, the technical set up is pointing to an evolving inverse head and shoulders pattern which could see prices dip before rallying to 104.00
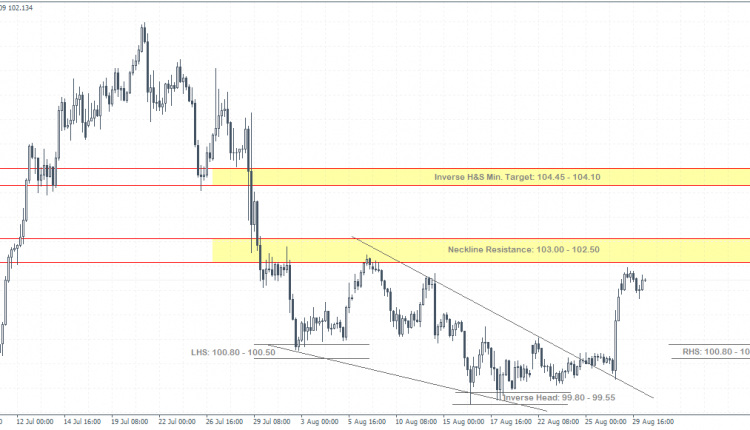
USDJPY – Evolving Inverse head and shoulders pattern
We currently expect USDJPY to retest this resistance level near 103.00 – 102.50, and this could potentially form an evolving inverse head and shoulders pattern with the possibility that USDJPY will retrace back to 100.80 – 100.50 to form the right-hand shoulder. This also coincides with the retest of the breakout level from the falling/descending wedge pattern.
If USDJPY forms a reversal near 100.80 – 100.50, we could expect a rally back to the resistance or the inverse head and shoulders neckline resistance at 103.00 – 102.50. A breakout above this level could signal a measured move towards 104.455 – 104.100

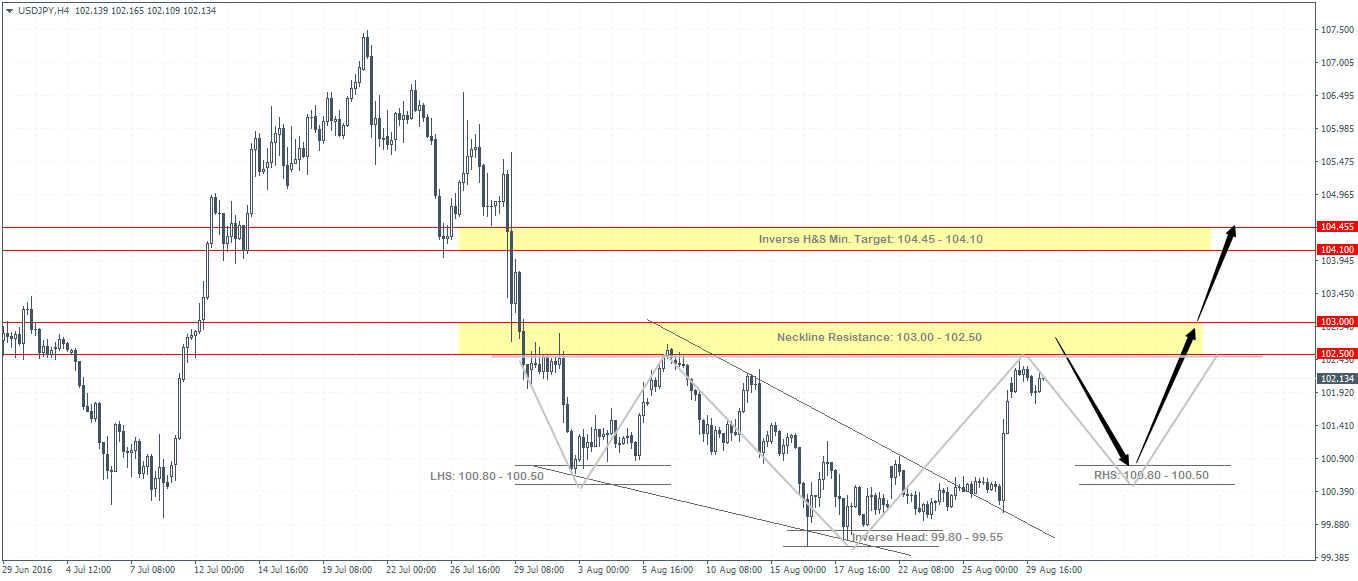
USDJPY H4 Chart
How to trade USDJPY?
Intraday traders could benefit from taking long positions near 100.80 – 100.50 which is the bottom end of the right shoulder, giving an early lead advantage. Half the position can be closed out near 102.50 while the remainder can be left open, targeting 104.00. In terms of risk, the initial stop loss can be set to 99.80 and after price rallies to 102.50, the stop loss can be moved to 100.80, making it essentially a risk-free trade.
Trade Invalidation
- If USDJPY breaks above 103.00 on the current leg in the rally and continues higher, it would invalidate this setup.
- If USDJPY breaks down below 100.50 and falls to 99.80 level, it could weaken the inverse H&S structure.
- If USDJPY reverses without testing the neckline resistance at 103.00 – 102.50 it would weaken the inverse H&S structure
Timing!
The timing of the trade is very important as price approaches the RHS zone of 100.80 – 100.50. Secondly, the timing is also crucial when/if USDJPY rallies back to 103.00 – 102.50.
Potential catalysts, therefore, may come from the fundamentals. Here is the US economic calendar to keep an eye on. For Japan, the economic calendar is quiet.
- Wednesday, Aug 31 (1215 GMT) – USD, ADP Payrolls (exp.173k, prev. 179k)
- Thursday, Sep 1 (0100 GMT) – CNY, Official Manufacturing PMI (exp. 49.9, prev. 49.9)
- Thursday, Sep 1 (0145 GMT) – CNY, Caixin Manufacturing PMI (exp. 50.1, prev. 50.6)
- Thursday, Sep 1 (1400 GMT) – USD, ISM Manufacturing PMI (exp. 52.0, prev. 52.6)
- Friday, Sep 2 (1230 GMT) – USD, Non farm payrolls (exp. 185k, prev. 255k)
- Friday, Sep 2 (1230 GMT) – USD, Unemployment rate (exp. 4.80%, prev. 4.90%)

