
Gold prices might have posted a strong rally last week after prices briefly traded above the $1300 handle to post a new yearly high of 1315 but the failure to follow through from here is indicating a potential downside in the safe haven metal.
The weekly Commitment of Traders report showed a record increase in the net long positions in gold. The bullish increase was as expected as the UK heads to polls to vote on the EU membership tomorrow. However, the bullish positioning also shows that with the Brexit risks being priced in, gold prices are more vulnerable to the downside risks than post any meaningful rallies. As of June 14th, speculators were net long 47,850 contracts in gold marking an all-time high in the gold’s CoT report history. It was also the largest week over week increase in positioning.
Gold also gained as last week, the US Federal Reserve bank left interest rates unchanged and so did a lot of other central banks including the Bank of Japan and the SNB. While gold prices seemed supportive on the data, latest Brexit polls showing a neck and neck outcome on the referendum vote has seen gold prices pull back.
It was only last week that many analysts were calling for further upside in gold prices, with some going as far as calling 1300 the new norm in gold. However, this week’s UK referendum event will be key towards providing more clarity for the gold markets.

Gold – Technical Outlook
The weekly chart for gold paints an interesting picture as we see that the previously established resistance near 1303 – 1294 has managed to cap the prices. Although gold prices rallied above 1303, failure to close above this level is indicative of a possible shift in sentiment. At the time of writing, gold prices are trading at 1268, and a weekly bearish close could signal a confirmation of a move to the downside. The weekly chart below shows the initial support at 1260 – 1253 as the main support level of interest. A break below 1253 could trigger further downside for a move to 1230 and eventually to 1200. In the longer term, gold prices could slip down to 1172 – 1164 major support identified on the weekly chart.
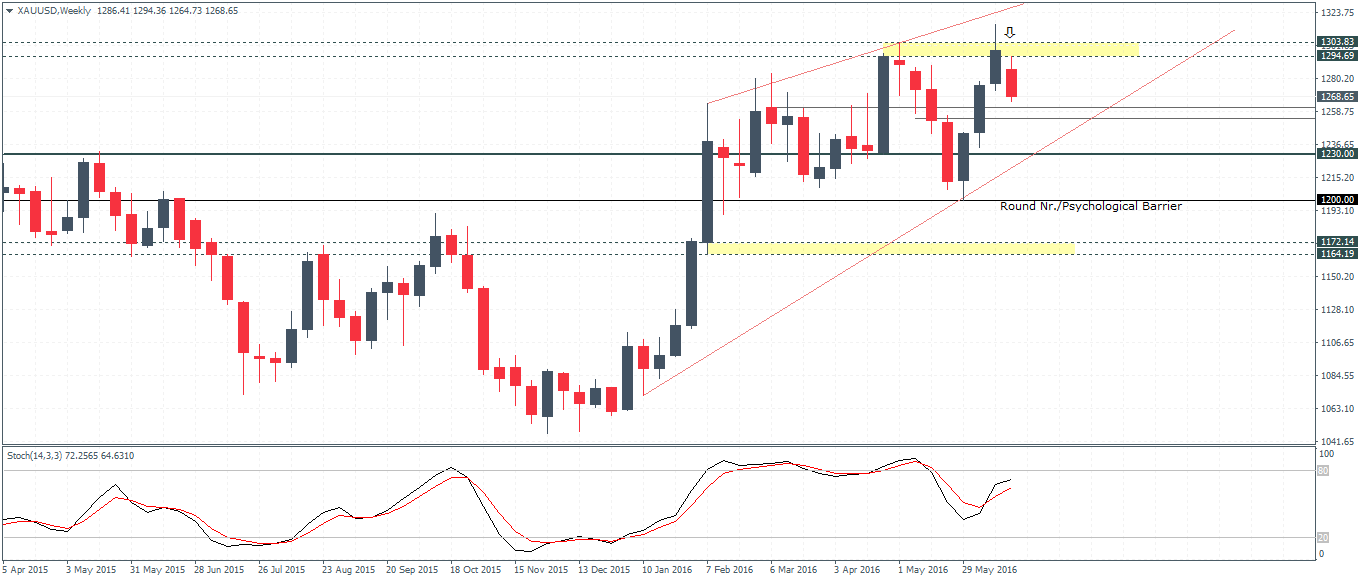
Further adding to the bearish view is the weekly chart Stochastics which is currently posting a lower high against the higher high in prices. This signals a near-term correction down to 1172 over the next few months.
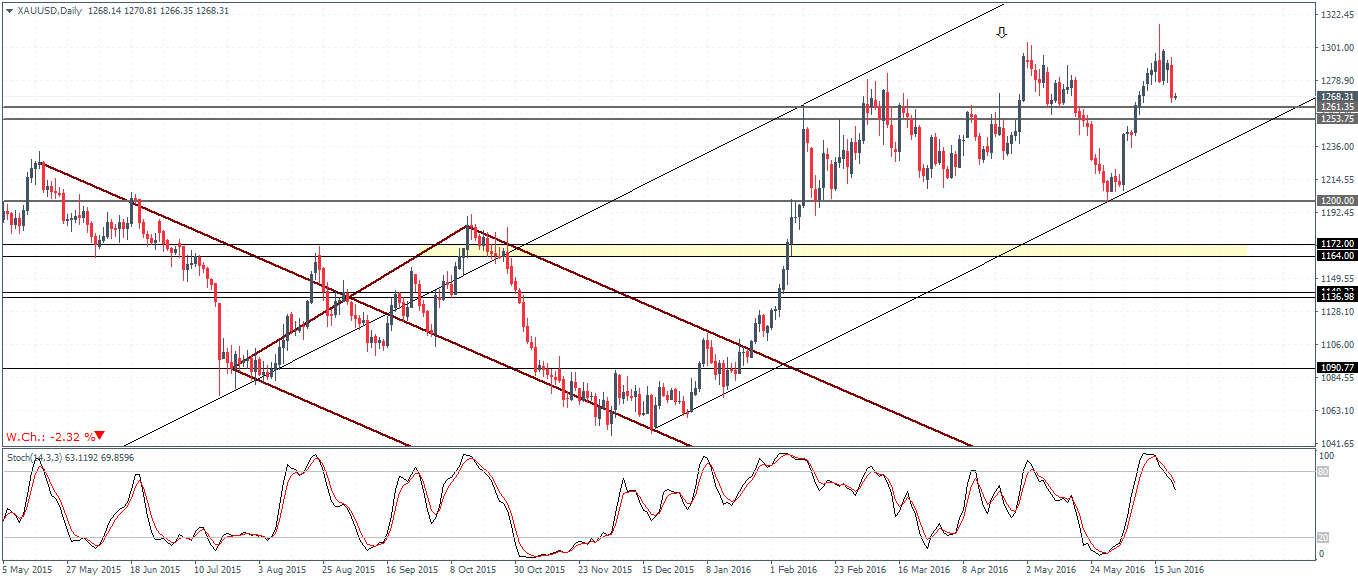
On the daily chart, gold prices have been retreating down to the 1268 – 1253 support level with 1300 coming in as resistance. Any risk related rallies into the Brexit vote could see gold prices potentially move back to $1300 resistance but further upside is unlikely, unless strong support is established near 1261 – 1253 support level. In such an event, gold prices will have to break above 1300 and eventually slide back to establish support at $1300 for further upside. Alternately, a break below 1253 could see gold prices slide to the eventual round number support at 1200, in which case the 1261 – 1253 level could come in as a new resistance and hold the rallies in the near term.

