How much more can the gold rally sustain? On a year to date basis, the precious metal has carved for itself a unique distinction of gaining over 20%.
A quick comparison of the US stock indices shows Gold’s performance out beating every other asset. The rally in the commodity has sent gold mining stocks on a bullish run, with just about every analyst upgrading their price targets.
More recent to join the bullish crowd includes Credit Suisse, which now assigns a $1350 price target for gold by the first quarter of 2017. BMO Capital expects gold to rise to $1400 by this year end, while Goldman Sachs is skeptical on the precious metal’s outlook, although upgrading its price targets to $1200, $1180 and $1150 per ounce over the three, six and 12-month period.
Combining the weekly CoT data and the growing bullish calls on gold, it is anyone’s guess on how price action may unfold in gold. With an extreme positioning, the markets tend to snap back rather sharply. An evidence of this was seen most recently in the USDJPY trade. It saw a sharp reversal after speculators were net long on the yen, only to see the dollar fall back sharply after the BoJ’s April decision to leave policy unchanged. More recent net speculative shorts on the US dollar saw the greenback fall to an 18-month low only to reverse off the 93 handle and rather strongly.

The above shows evidence that as far as the retail trader is concerned, buying gold at the current levels would leave them vulnerable to potential shake-ups in the markets, unless one is well capitalized and employs good risk management to sustain such a move.
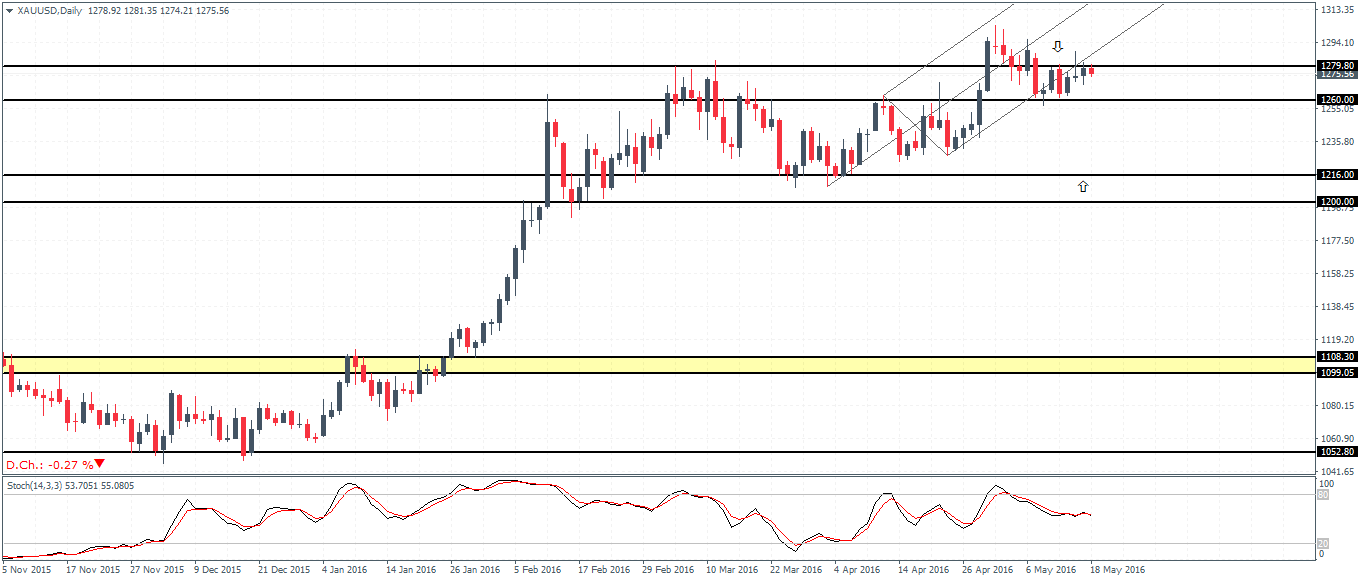
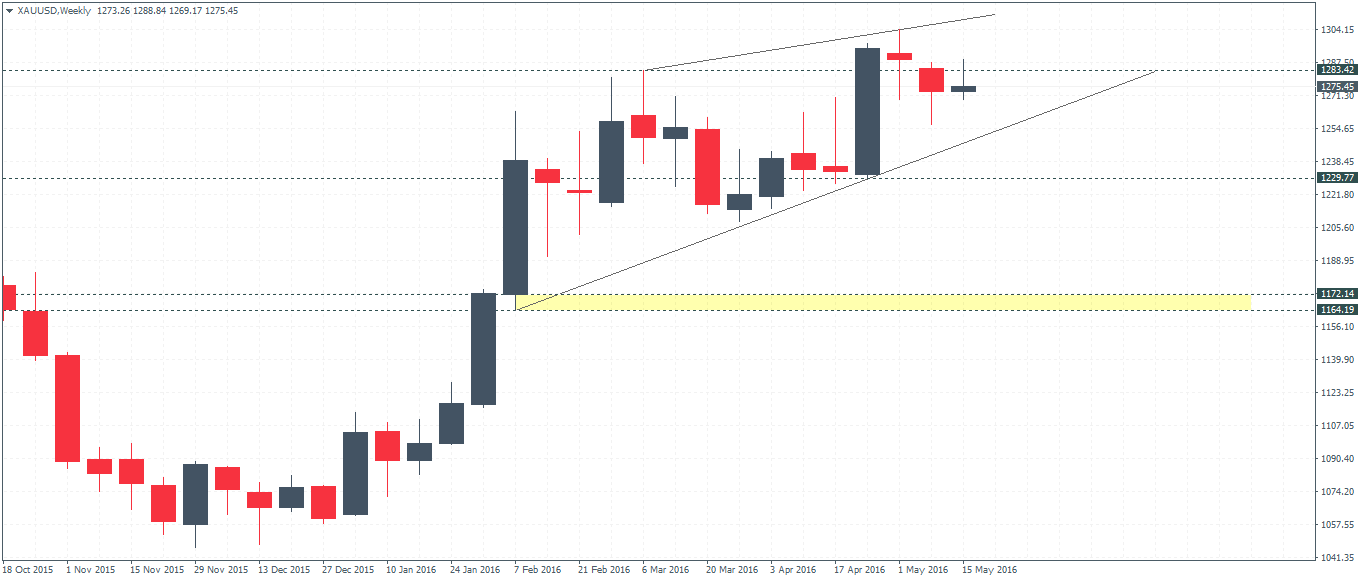
Gold – Technical Outlook
The weekly chart for gold shows prices back near the 1275 – 1284 level of resistance. Prices rallied back to this level despite the doji and the bearish closing last week. Taking a cleaner view of the weekly chart, gold is seen to be consolidating in a rising wedge pattern with 1229 support being a critical level to watch for. A weekly break below this level could see the declines accelerate strongly given the crowded long positions at the recent highs.
On the daily chart, we notice that after the price was moving in a rising median line, more recently, the breakout from the lower median line saw price action consolidating below 1279 resistance/support level. Although not conclusive, the initial price behavior here shows that gold could be biased to the downside in the near term. As long as the most recent doji high is not breached, gold could push lower to 1260 support.