
Silver prices outperformed Gold over the week as silver is currently up 4.23% on a week to date basis while gold cut shot its gains, currently up 0.70%. With prices of both metals poised to the upside, it is likely that silver could see further upside compared to gold. Over the week, the initial risk off sentiment which saw the Japanese yen touch a 17-month low saw the flight to safety trade pushing prices higher. The US dollar was trading week and just yesterday touched 94.0, a 6-month low in the dollar index. Both the precious metals are bullish in.
Over the week, the initial risk off sentiment which saw the Japanese yen touch a 17-month low saw the flight to safety trade pushing prices higher. The US dollar was trading week and just yesterday touched 94.0, a 6-month low in the dollar index. Both the precious metals are bullish in wake of increasing chatter of ‘Helicopter Money’ and further cuts to interest rates. While the equities should have been performing strongly, the moves were limited and instead the precious metals saw a strong rally, indicating that the markets were really cautious on which way the global economy is heading.
However, an interesting point to note is that with oil prices turning higher and clearly indicating that a bottom is in place, inflation should start to push higher eventually. This week’s inflation data across various developed economies showed just that as inflation in some parts surged to a one-year high. If higher Oil prices are here to stay which could in turn boost consumer prices higher, it is very likely that tighter monetary policies will continue, which could in turn remain bearish for the precious metals.
Gold – Technical Outlook

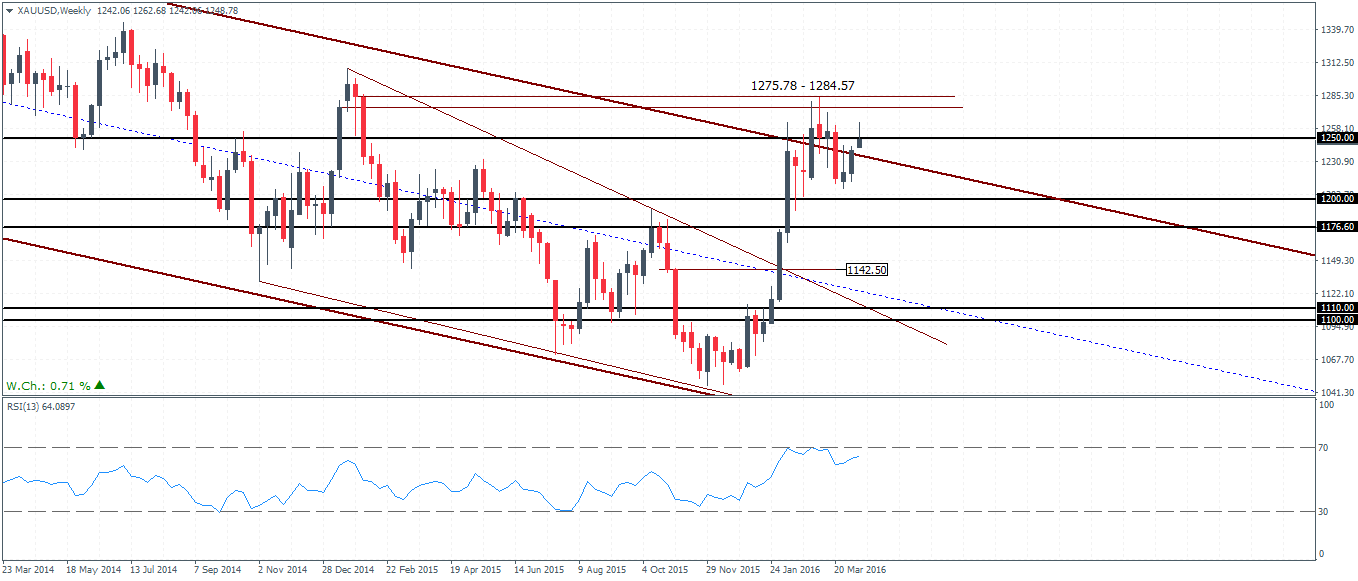
The weekly chart for gold shows price action reversing just above the 1200 handle and the bullish price action sent prices back to the 1250 handle. While prices are still evolving, a bearish close (current weekly open at 1242.06) on the week could signal that gold prices could be pushing lower. While the support at 1200 – 1176 is clear on the weekly chart, 1142.50 is starting to look like a possibility. Also bear in mind that the monthly chart closed with a doji pattern in March (low of 1208.38) and a convincing close below this level on the weekly session could confirm the downside view.
On the daily chart, price action is currently bearish following a retest back to 1250 handle. Yesterday’s doji pattern indicated a pause to the rally but a daily close below 1251.38 could signal the downside momentum. However, 1231.37 marks the breakout from the falling wedge pattern, so the support here could hold the declines initially. Any bounces off 1231.37 could no doubt send gold prices back to 1250 or potentially keep the price action to range sideways. Only a daily close below 1231.37 will confirm the further downside bias for a test to 1200.
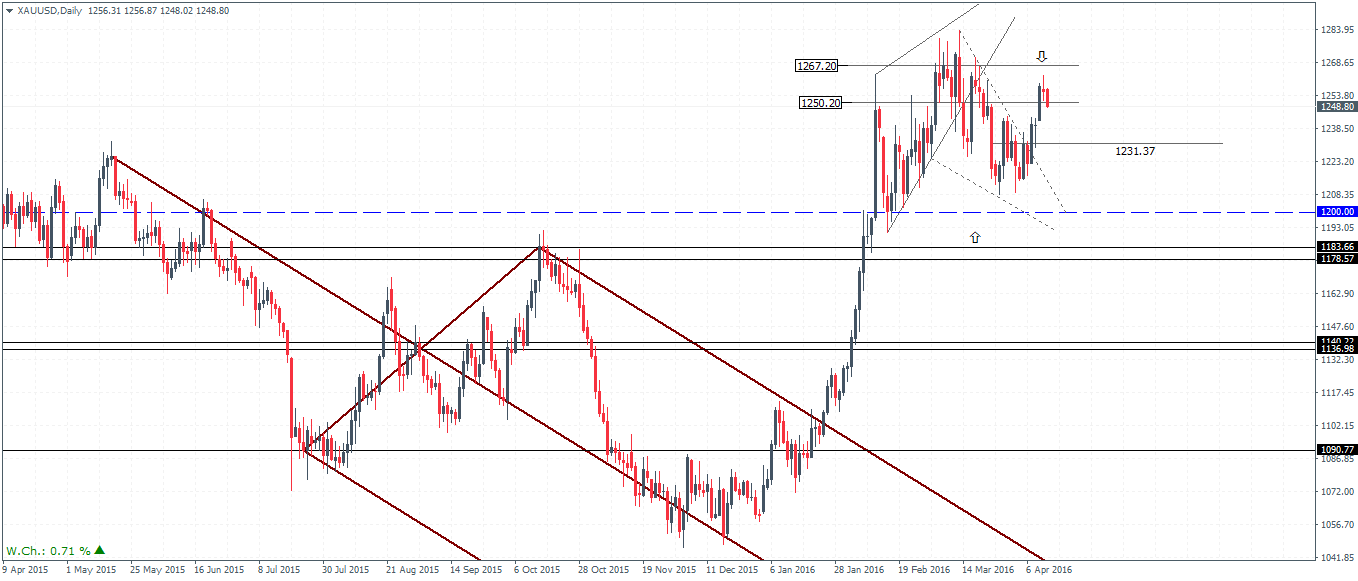
To conclude, Gold prices are likely to move sideways but the downside bias is starting to increase. 1231.37 will be the initial support which needs to be broken for prices to confirm a move lower to 1200, otherwise, gold could remain range bound within 1250 – 1230 levels.
Silver – Technical Outlook
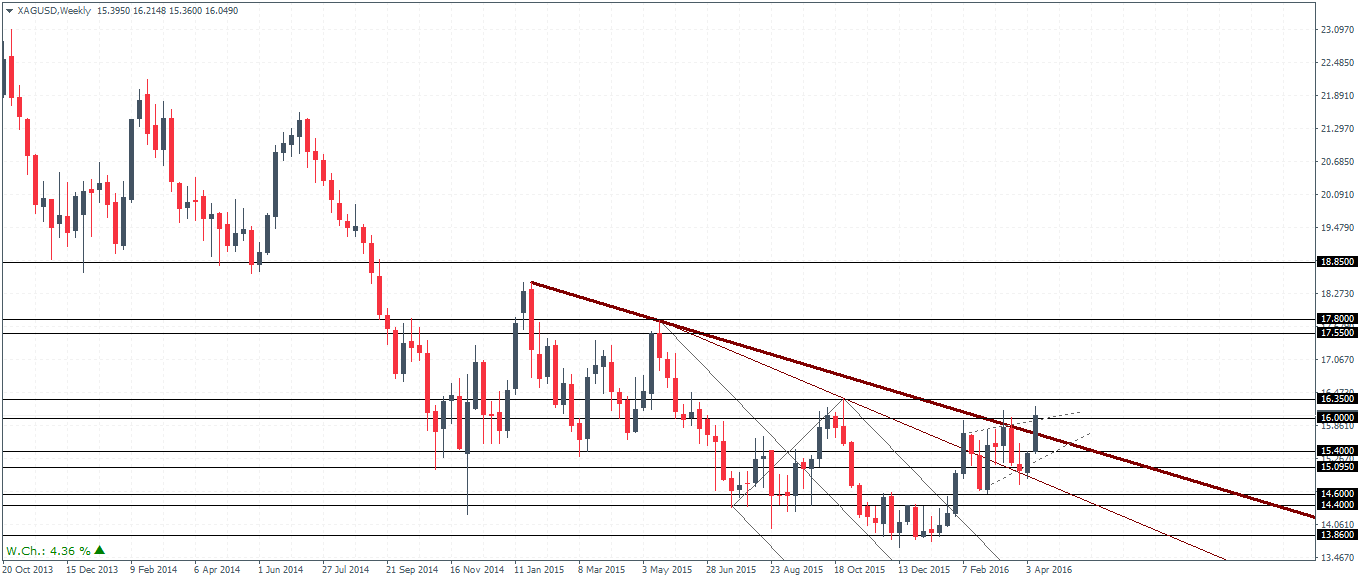
Silver prices posted a minor higher high this week at 16.21, posting a 24 week high. However, price action is trading in the resistance level of 16.35 – 16.0 and could see the upside momentum stalling for now. Only a strong close above this resistance could confirm further upside in silver for a test to 17.8 – 17.5 levels. To the downside, prices are well supported near the 15.4 – 15.09 levels which could keep silver prices moving sideways. With price action trading near the longer term trend line, a weekly close above this level could see some upside bias building in.
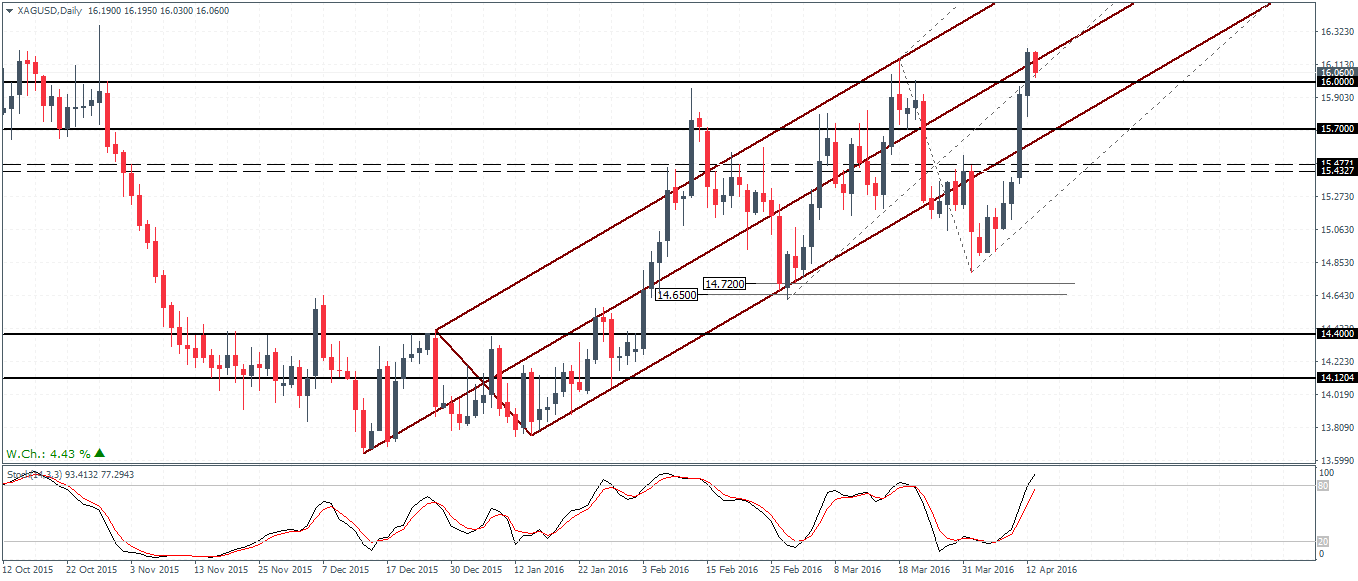
On the daily chart, silver prices are currently trading near the longer term median line. A bearish close below 16.0 could see a move to 15.70, but if 16.0 holds as support, silver could see another leg to the upside. The lower support at 15.47 – 15.43 will be most likely tested to the downside following a breakout higher with the levels failing as resistance. In the near term, silver could continue to range sideways within 16 – 15.43.
To conclude, silver prices are likely to stay range bound within 16 and 15.4 levels. With the weekly chart showing price trading near the long term trend line an horizontal support, we could expect a dip in the near term.

![Credit Card 160×600 [EN]](https://assets.iorbex.com/blog/wp-content/uploads/2023/06/13144507/Blog-Banner_EN-Banner_160X600X2.webp)