
Precious metals are trading mixed this week but are relatively stronger compared to their peers. Gold prices on a week to date basis has gained 0.20% while Silver has moved 0.71% higher. Overall, the precious metals are well supported this week with China continuing to worry the markets leading the precious metals higher as investors prefer to hold on to the safe haven Gold. Also, the falling Oil prices have put pressure on many markets leading to further concerns for the risky equity assets.
Gold – Technical Outlook
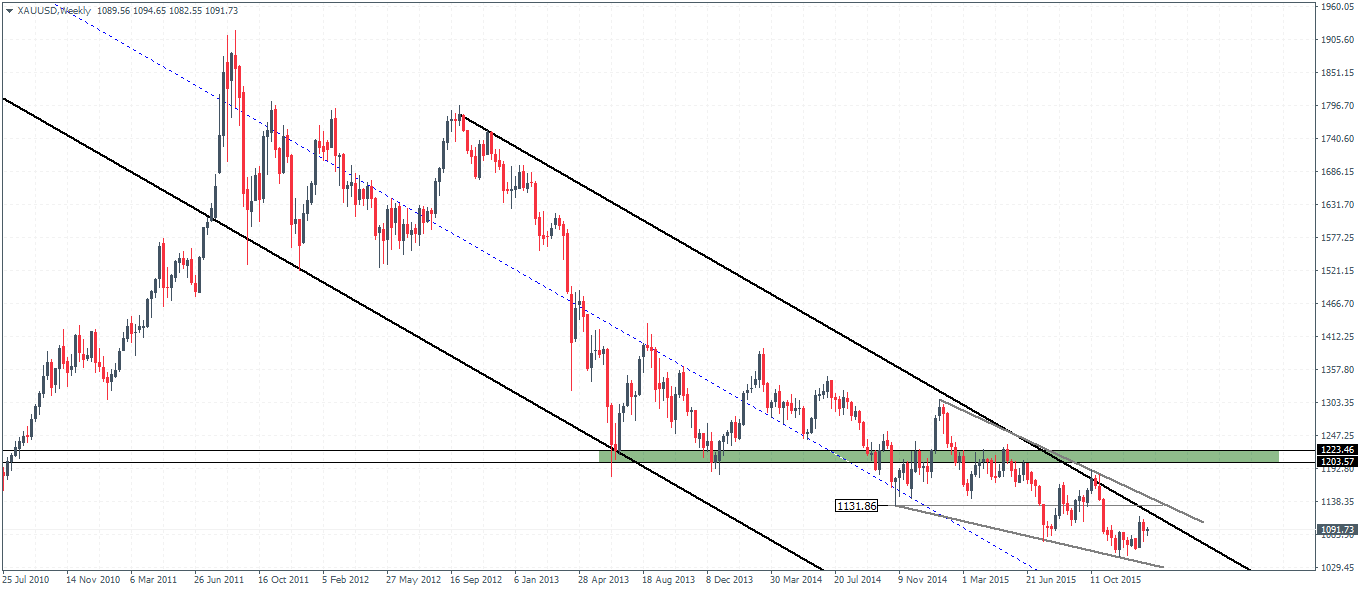
The weekly chart for Gold gives a long term view where prices are consolidating inside the falling wedge pattern with 1131.86 being a key level. A break above this price level could mark the start of a potential short-term rally in the markets which could see an eventual move towards 1223 – 1200 region in the medium to long term basis which would mark a retest of this broken support level for resistance. The monthly chart will offer clues as this month’s price action needs to close on a bullish note after December 2015’s Doji candlestick pattern. So far price is trading above 1088 level but a monthly close above 1088 could signal the move to the upside.

On the daily chart for Gold, the price is currently range bound after a short rally to 1107 – 1101 level of resistance. However, another test back to 1074 lows which marks the breakout of the minor consolidation pattern on the daily chart could signal a move higher. A break above 1107 could mark a test to 1131 – 1140 region and a break above 1131 – 1140 and potentially establishing support on this broken resistance could likely see further upside in store with the eventual test to the 1200 region.
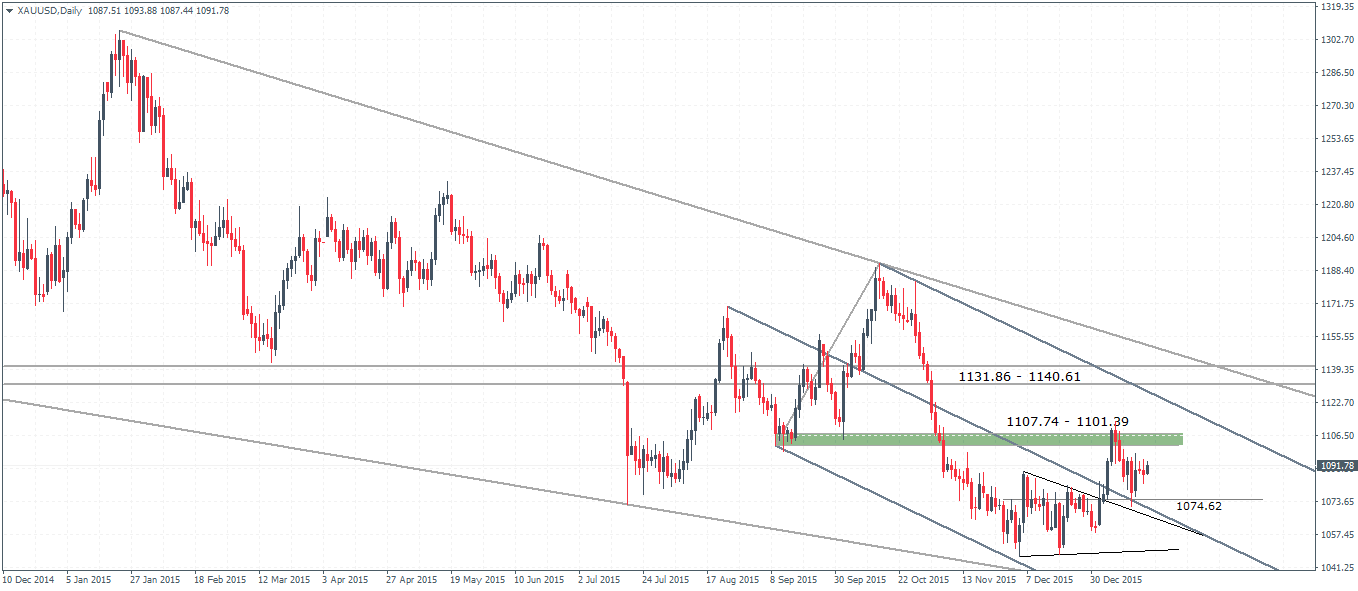
To conclude, Gold prices might be ranging sideways ahead of a breakout to the upside. The medium – long term bias is to the upside with Gold expected to post another rally to 1200 before resuming its downtrend.
Silver – Technical Outlook
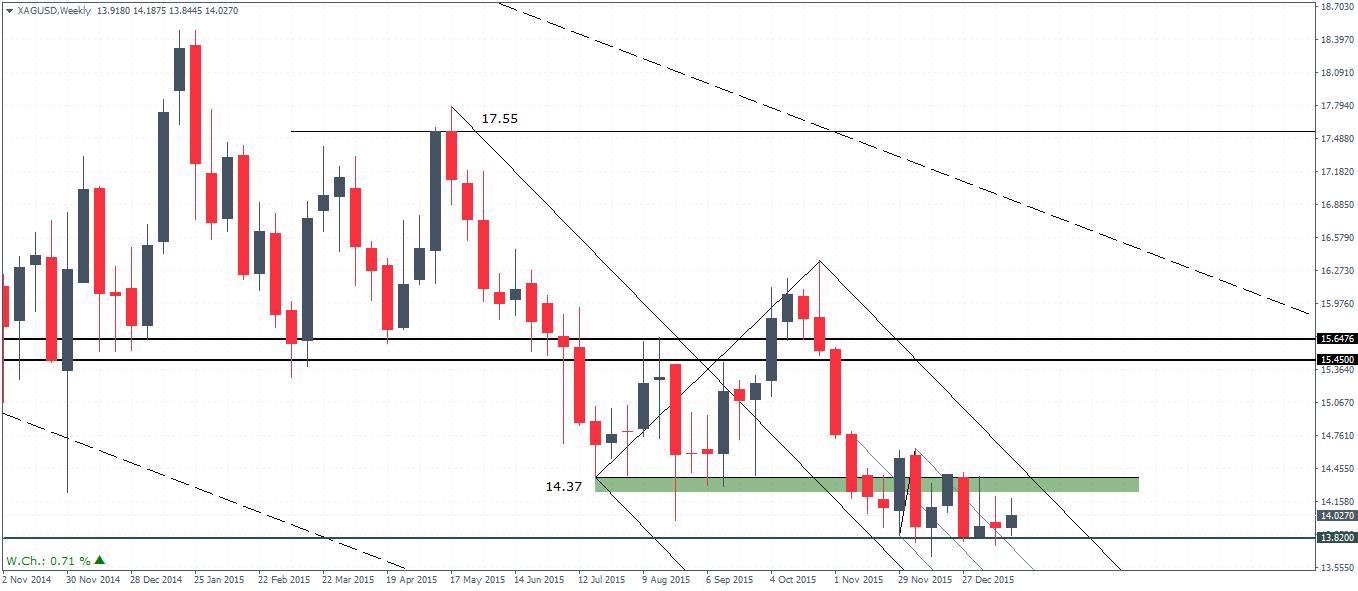
Silver prices have stayed flat and the price is looking to form a base near the 13.82 support, which has managed to hold prices strongly over the past 7 weeks. However, price action is likely to stay flat with prices stuck in a range below 14.37 resistance. The minor median line plotted on the weekly chart shows an upside breakout from the outer median line and a weekly close to the upside or a bullish candlestick pattern on the weekly chart could potentially threaten to break above 14.37 resistance and push higher. The longer term upside target to 15.45 still remains in play and could be more certain if Silver manages to establish support at 14.37.
On the daily chart, Silver remains very flat with prices moving sideways for the most part. However, with 14.12 – 13.99 resistance/support level showing a strong level of price consolidation we could anticipate a potential breakout in the near term. To the upside, 14.56 is a key level to watch while to the downside a break below 13.65 could signal further declines. Silver prices will have to potentially establish resistance above 14.12 region in order to confirm the bullish bias off the weekly chart.
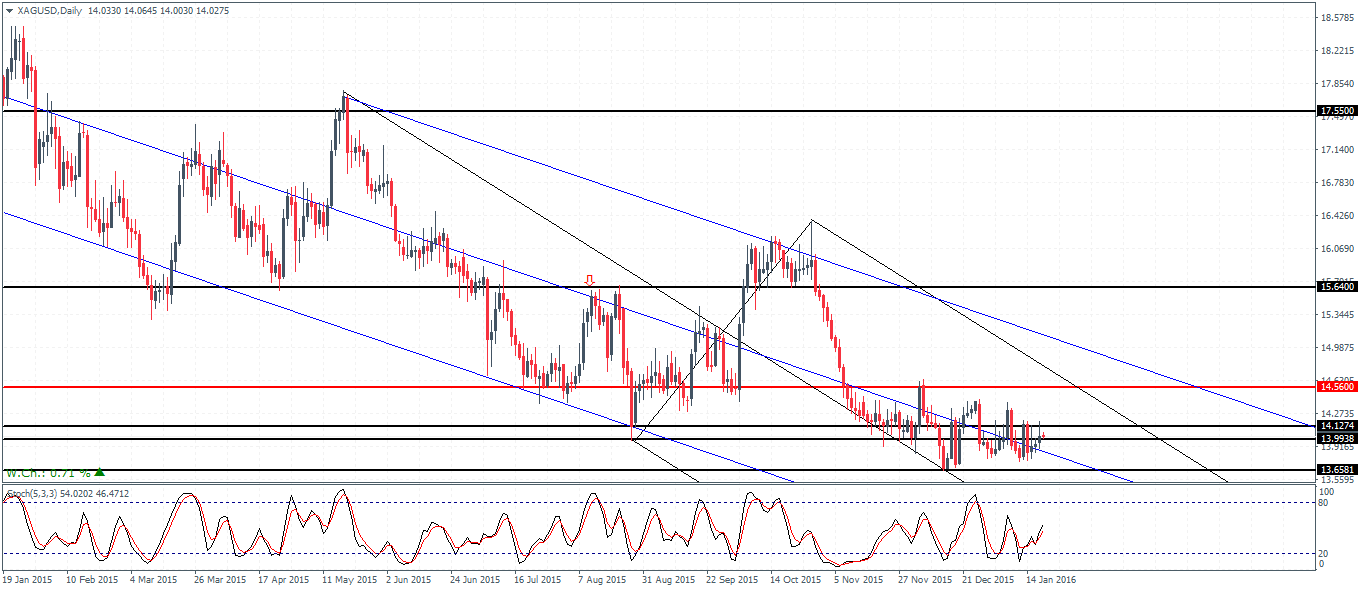
To conclude, Silver prices remain range bound for the moment but the potential for an upside correction is likely above 14.37 region.

