The EURGBP or the Chunnel has seen a wild ride in 2015. The Euro initially declined against a fundamentally stronger British Pound back when speculation mounted that the ECB would do more at its December policy meeting. However, falling short of expectations, the Euro has staged an impressive rally against the British Pound. In fact, at the time of writing, EURGBP is straight into a 7-week winning streak after price reversed off 0.70075 low in mid-November 2015.
Looking ahead, the EURGBP looks fundamentally and technically aligned to make further gains in light of the uncertainty surrounding the Brexit referendum and the fact that low inflation in the UK is likely to keep the BoE from tightening monetary policy any time soon. For the Euro, inflation still remains a concern, but the fact is that there is not much of ‘bad news’ that will compel ECB officials to justify further action. Another piece to the puzzle comes from Chinese uncertainty which is currently rattling both the equity and currency markets, which has led to the Euro turning out to be a surprise winner. With the above fundamental landscape in mind, the following charts show a potential big move that could be building up in EURGBP over the coming months.
EURGBP Weekly Chart – Inverse Head and Shoulders pattern
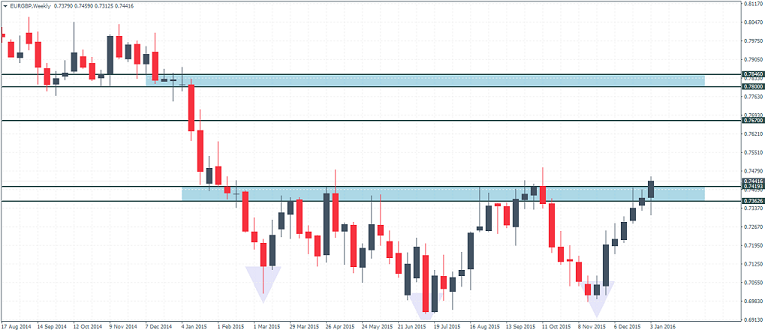

The first chart shows the inverse head and shoulders pattern that has been forming since February 2015 where the left shoulder was formed and the neckline resistance was established between 0.7419 – 0.7362. After prices declined sharply to post a new low near 0.6941 in July last year, prices managed to get on board another rally but it soon fizzled out as prices hit the neckline resistance, which led to a new leg of declines seen during the latter half of last year. The final higher low or the right shoulder was formed in November 2015 around 0.70 levels and since then prices started to post a steady and a strong uptrend.
At the time of writing, EURGBP is attempting to close above the neckline resistance price of 0.7419. A successful break above the neckline could set the inverse head and shoulders pattern in play with a rally that could reach 0.767 marking the 161.8% Fib level of the head and shoulders pattern followed by an eventual move to 0.78 – 0.7846 level marking the full measured move off the inverse head and shoulders pattern. Incidentally, the price zone near 0.78 – 0.7846 also happens to be a strong support level which was tested around November 2008 and later in July 2012 before giving way around August 2014.
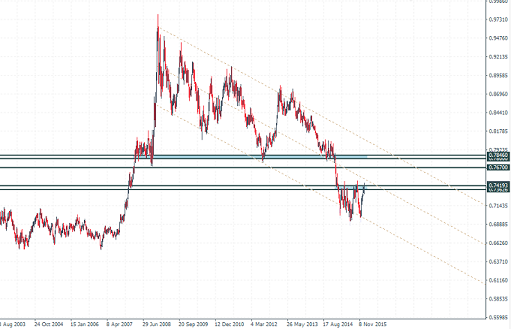
Needless to say, this broken support level hasn’t quite faced any resistance yet and the inverse H&S pattern could very well set the stage for this move. The chart below shows a zoomed out view to get a better view of the support level of 0.7846 – 0.78 including the price action in relation to the long-term standard deviation channel.
EURGBP H4 Chart – Bearish Divergence
The 4-hour chart for EURGBP paints an interesting picture, where we notice a strong rally with little to no clean pullbacks. Price action has posted new highs while the 13 period RSI has been posting a lower high. A bearish candlestick close or a doji close for that matter on the current 4-hour chart could signal weakness to the rally. Watch for the trend line that has been drawn connecting the lows of 0.7007 from December 1st, 2015 and the lows of 0.732 from 6th January 2016. A break of this trend line could signal a confirmed move to the price level of 0.7224 – 0.725 region where price action has previously shown some consolidation in the past. A retest to this key price zone could be just the pull back needed for EURGBP to gather enough momentum to convincingly break the neckline and eventually move higher.
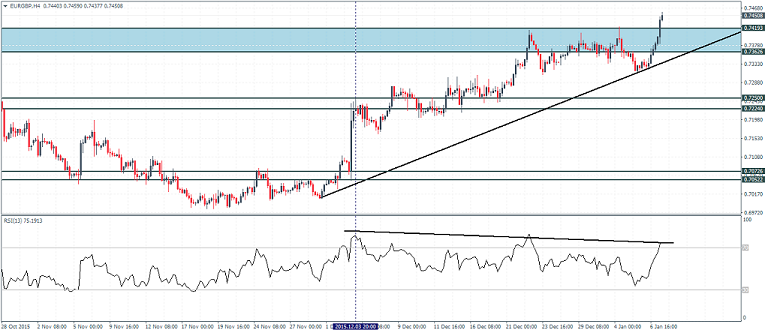
An alternative move is for a test to as low as 0.707 – 0.705 region where the next main support level comes in, but in such a scenario, the pullback to the right shoulder of the inverse head and shoulders pattern could put the pattern at risk. For the moment, watch the pullback to 0.7224 – 0.725 region within the uptrend with an eye for 0.767 and eventually to 0.78 – 0.784. The analysis is invalid on a daily or weekly close below 0.707 – 0.705.

![Credit Card 160×600 [EN]](https://assets.iorbex.com/blog/wp-content/uploads/2023/06/13144507/Blog-Banner_EN-Banner_160X600X2.webp)