
The US Dollar has been trending sideways for the past week but prices remain biased to the upside with the support at 95.72 – 95.45 holding up so far. The Dollar index has been mostly choppy as the currency index awaits today’s US nonfarm payrolls report with expectations that the US jobs added 201k new jobs in September. The jobs report is the only aspect that has been in focus at the moment with inflation remaining largely subdued. As long as the jobs continue to grow at at healthy pace, the US Dollar looks well supported in the near term as the Federal Reserve looks to hike rates sometime this year, as early as this month if data supports.
US Dollar – Technical Analysis
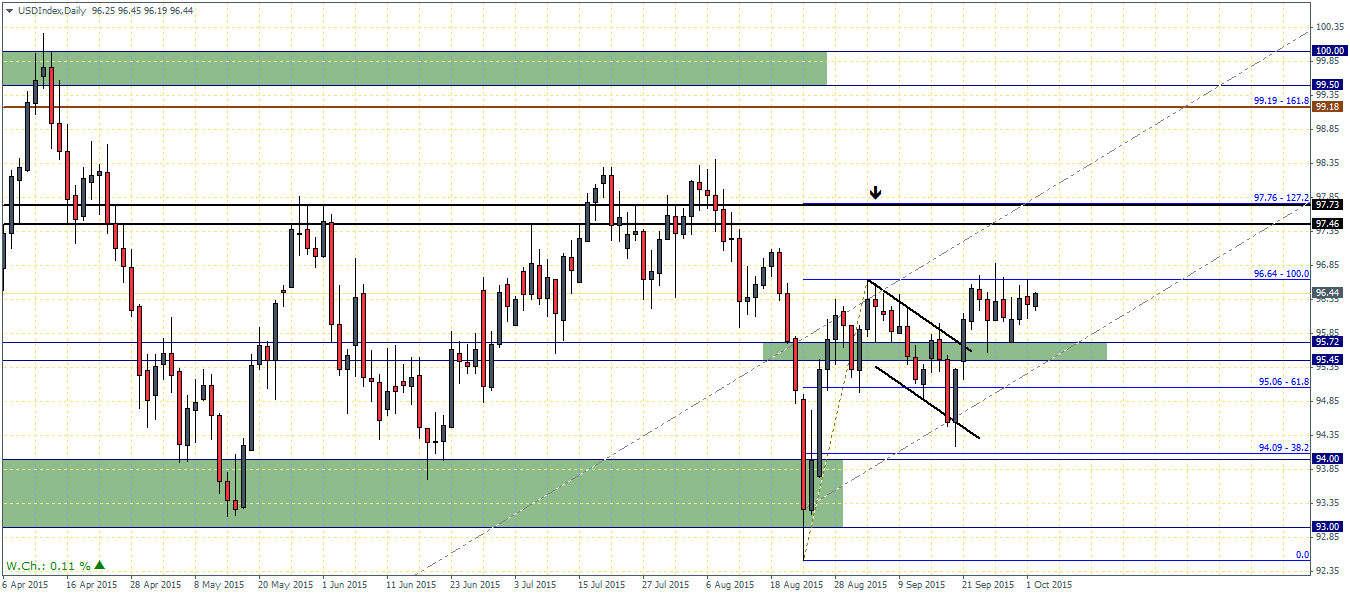
From a technical perspective, the Dollar Index remains poised to the upside with the bullish flag pattern still in play. Prices hit short term resistance at 96.64 and dipped lower to 95.72 a strong level of support that has held so far. The upside bias will see the US Dollar Index potentially test the next main resistance between 97.73 – 97.46 levels on a break above 96.64 with an eventual target to 99.18 on break above the resistance of 97.76 level.
In terms of the candlestick patterns there is no conclusive evidence of a directional bias at this point and therefore the Dollar Index will have to lead the way in terms of break above 96.64 resistance. Alternatively, if prices fail to clear 96.64 and instead drop back lower, the support at 95.72 through 95.45 is bound to support prices in the short term. But a break lower could potentially turn bearish for the US Dollar index with the next major support coming in only at 94.09 – 94 region.

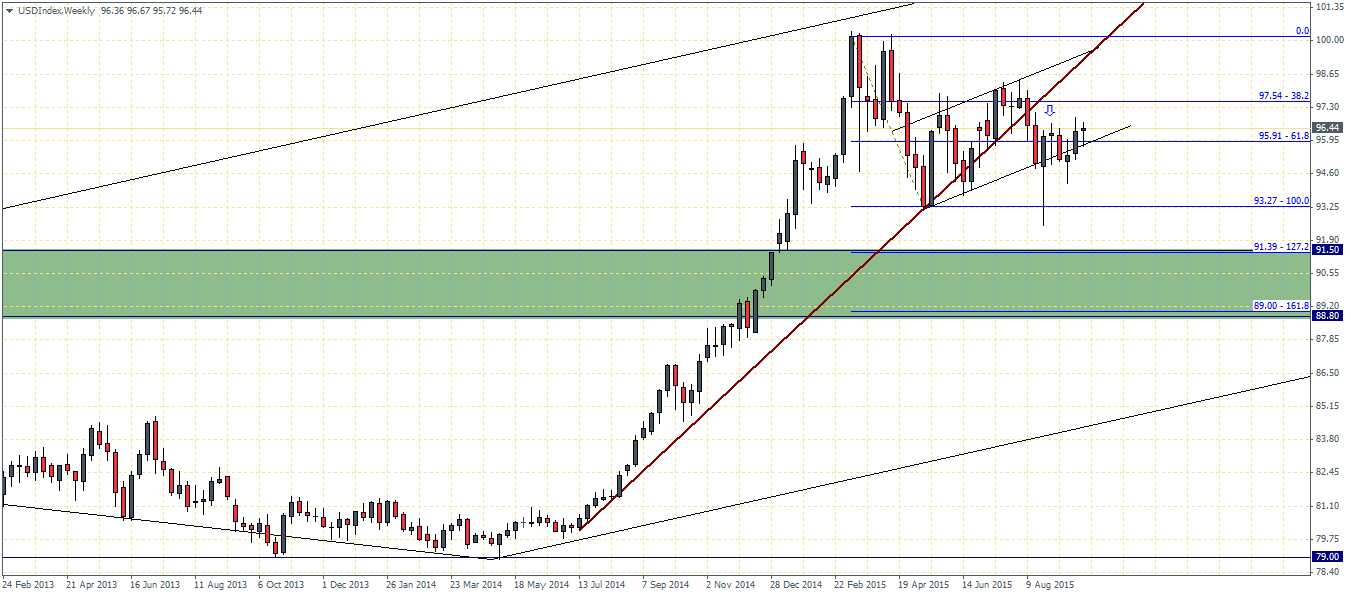
On a weekly basis the US Dollar Index paints a different picture with the main trend line being broken. There is the potential bear flag pattern that is currently taking shape. However, the last three week’s candlestick pattern has resulted in a bullish reversal pattern indicating a move to the upside. The Dollar Index will have to rally above the breakout level at 97.54 in order to confirm the bullish bias from the daily charts. The weekly chart points to the main support at 93.27 support which would be very bearish should prices break out of the bear flag pattern, which could be followed by a decline to 91.40.
The 4-hour chart time frame however, points to a clear upside bias but only on break of the current resistance near 96.6 through 96.4 region. Prices have failed to rally above this resistance level and made multiple tests to the inverse head and shoulders neckline.
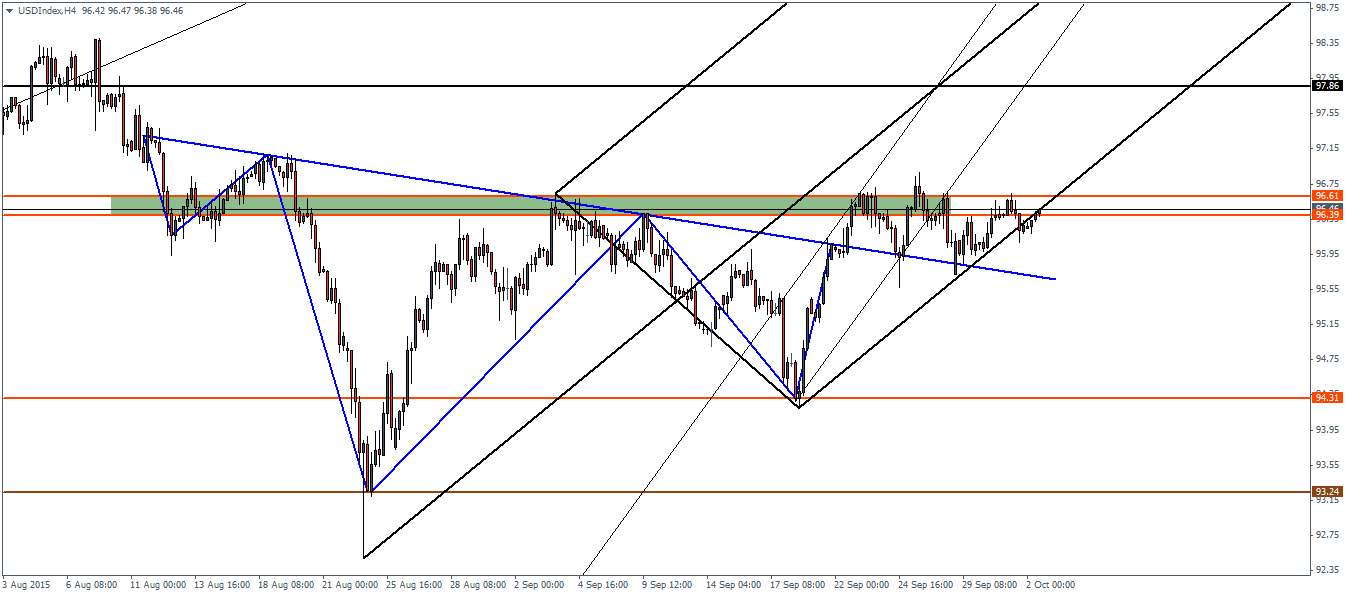
Prices are also supported by the lower median line on the charts. So intraday, a break above 96.6 will confirm a test towards 97.86 marking the measured move from the inverse head and shoulders pattern. However, there are significant risks with price trading below the resistance the lower median line. Failure to rally above resistance will clearly turn bearish for the US Dollar Index which could eventually decline lower to the next main support at 94.3 support

![Credit Card 160×600 [EN]](https://assets.iorbex.com/blog/wp-content/uploads/2023/06/13144507/Blog-Banner_EN-Banner_160X600X2.webp)