
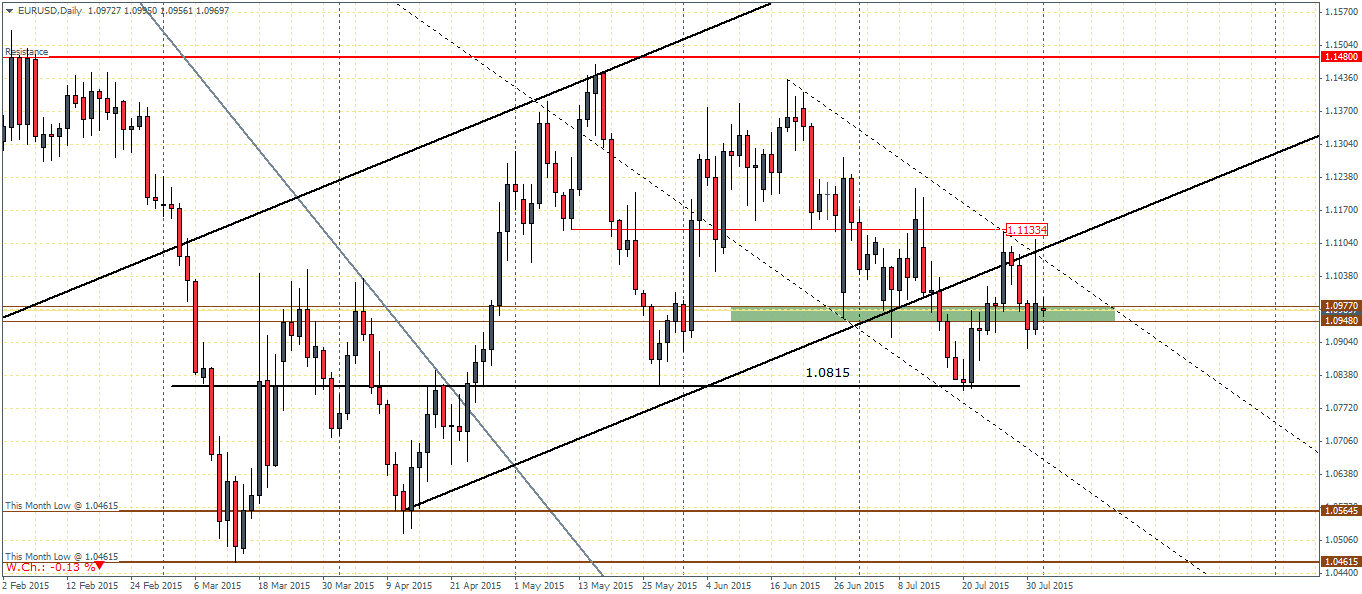
EURUSD (1.09): The single currency could soon turn weaker as the consolidation near the current support/resistance level at 1.0977 through 1.0948 could see a decline to 1.0815. We however see EURUSD could continue to remain sideways into this Friday’s US jobs report. The bias however remains to the downside, with a potential test to previous lows at 1.04615. Alternatively, a break above the current falling price channel could see EURUSD head back up into the previous rising channel above 1.1133 which will then shift the bias for a strong corrective rally to 1.148.
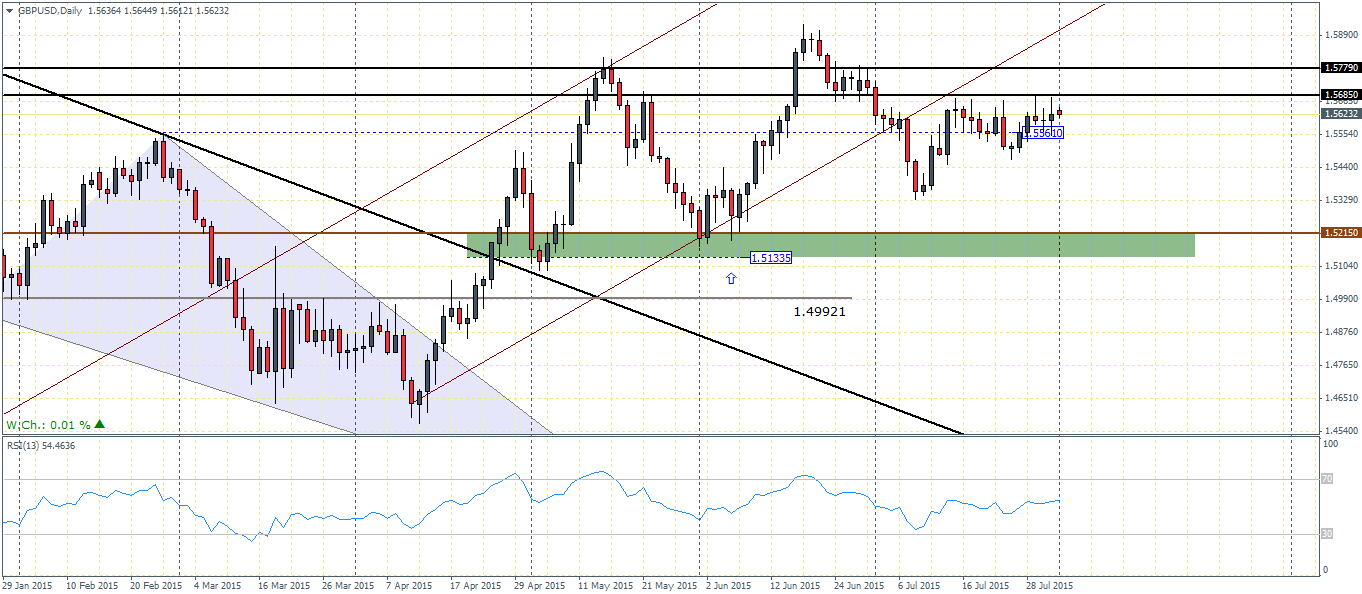
GBPUSD (1.56): GBPUSD has been flat for the past few weeks. But price action has been consistently below the major resistance at 1.578 through 1.5685, which points to a possible breakdown of prices which will see GBPUSD test the lows of 1.5215 level of support. To the upside, a break of the resistance at 1.578 is needed to ascertain a bullish view in prices.

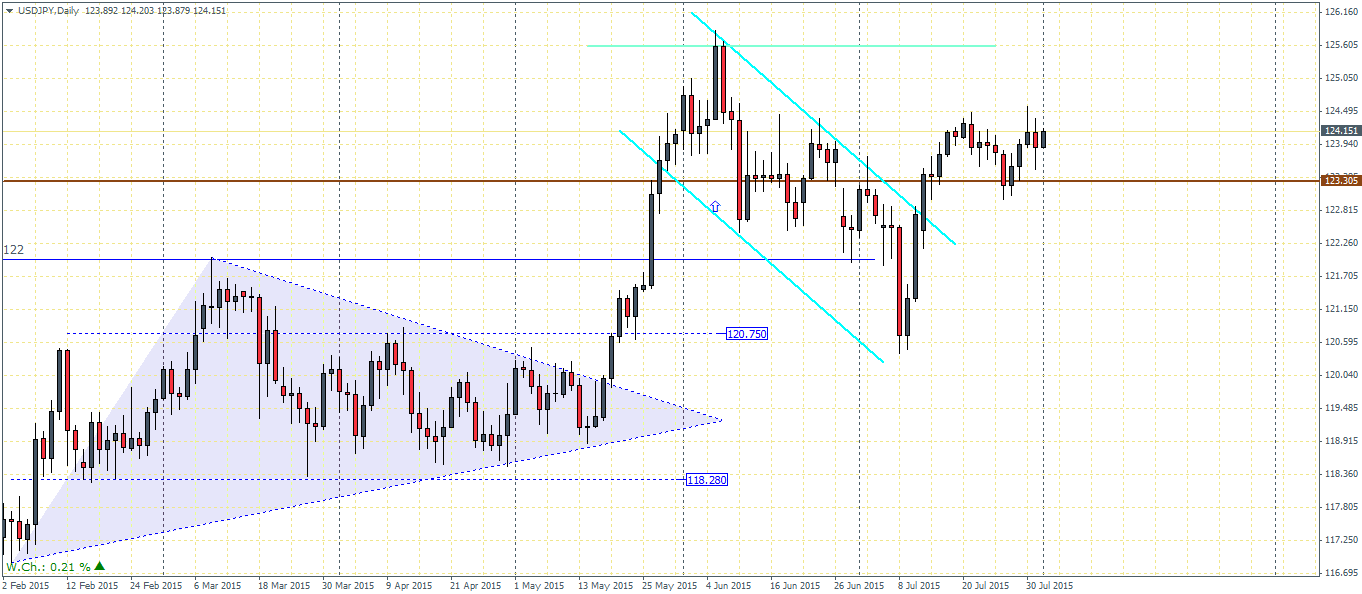
USDJPY (124.1): The brief test to 123.305 is likely to hold as USDJPY aims for the next major level at 125.5, which marks the first milestone in the major long term bull flag that has formed. However, there remains a risk of a break of 123.3 level of support which could put the upside bias to question as USDJPY will decline to find support at 122 which could result in a renewed resistance being formed at 123.3
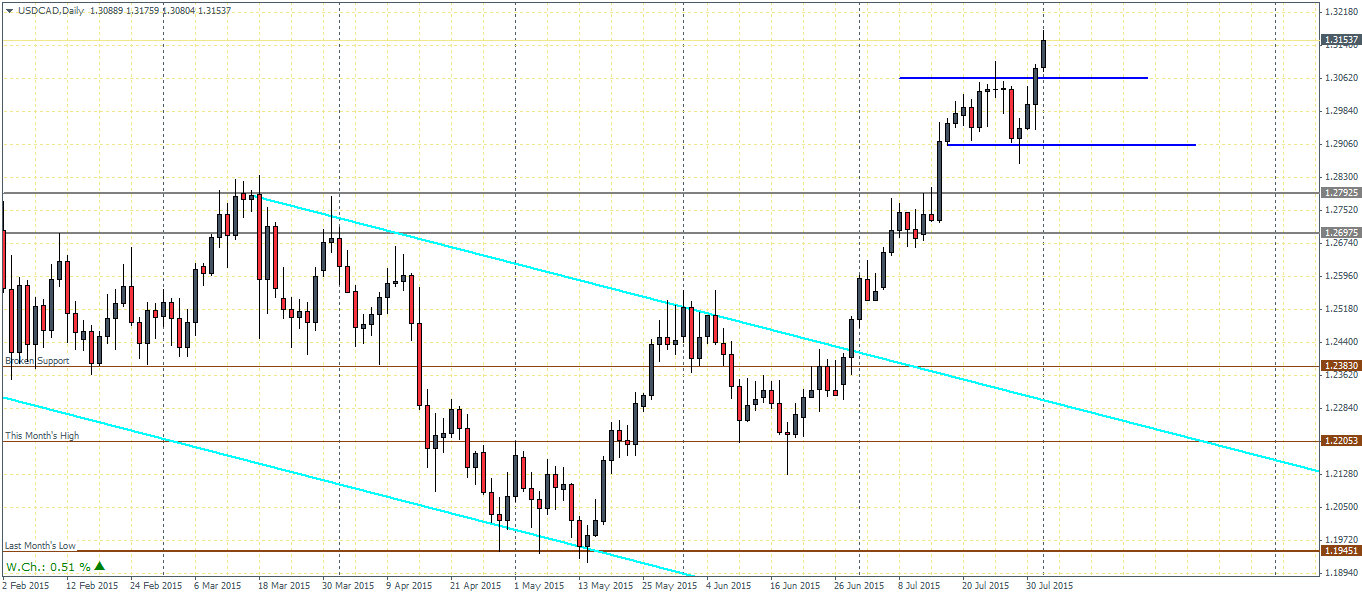
USDCAD (1.31): The USDCAD remains in a strong bullish uptrend and is currently testing fresh highs for the year. Support comes in at 1.3062 ahead of further gains. In the event, the support fails to hold prices, USDCAD could decline back into the range zone between 1.3062 through 1.2906. Longer term support at 1.27925 remains an area of interest as a test of support at this level is essential to pave way for further gains in USDCAD.
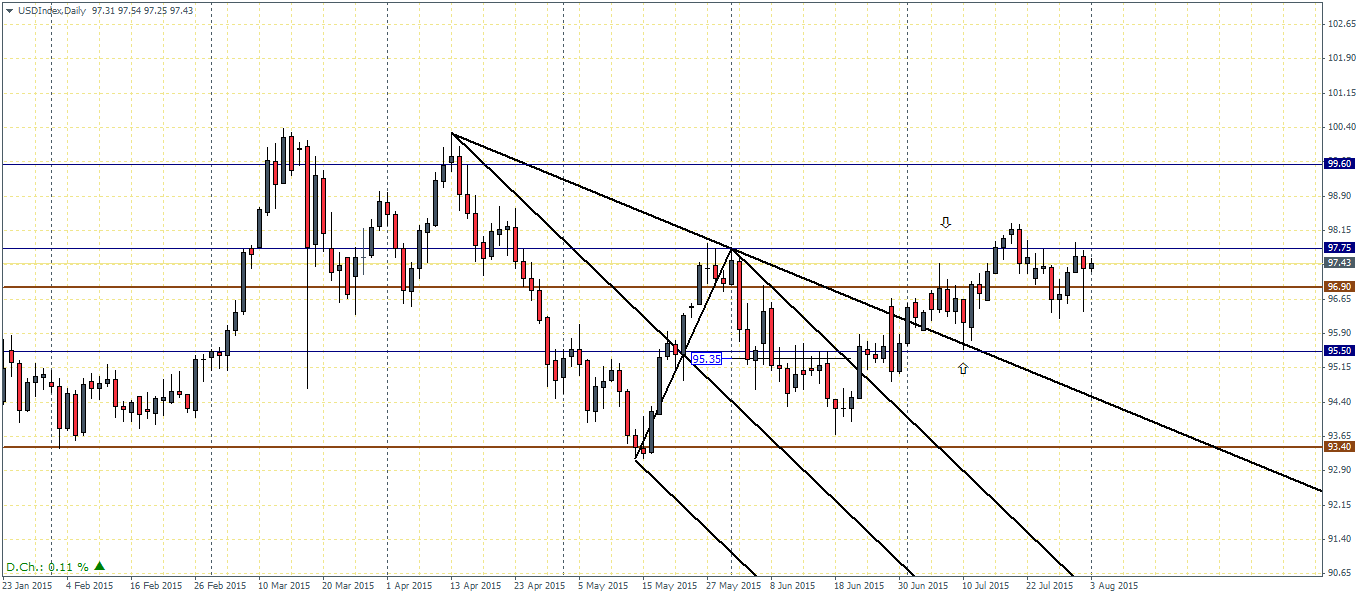
US Dollar Index (97.4): The US Dollar Index is trading within the 97.75 through 96.9 level of support/resistance. Price needs to break this range to set a new directional bias. To the upside, a break above 97.75 will see a test to 99.6, while to the downside, support comes in at 95.5 on break below 96.90.

![Credit Card 160×600 [EN]](https://assets.iorbex.com/blog/wp-content/uploads/2023/06/13144507/Blog-Banner_EN-Banner_160X600X2.webp)