
EURUSD Daily Pivots
| R3 | 1.118 |
| R2 | 1.1147 |
| R1 | 1.1126 |
| Pivot | 1.1095 |
| S1 | 1.1073 |
| S2 | 1.1042 |
| S3 | 1.1021 |
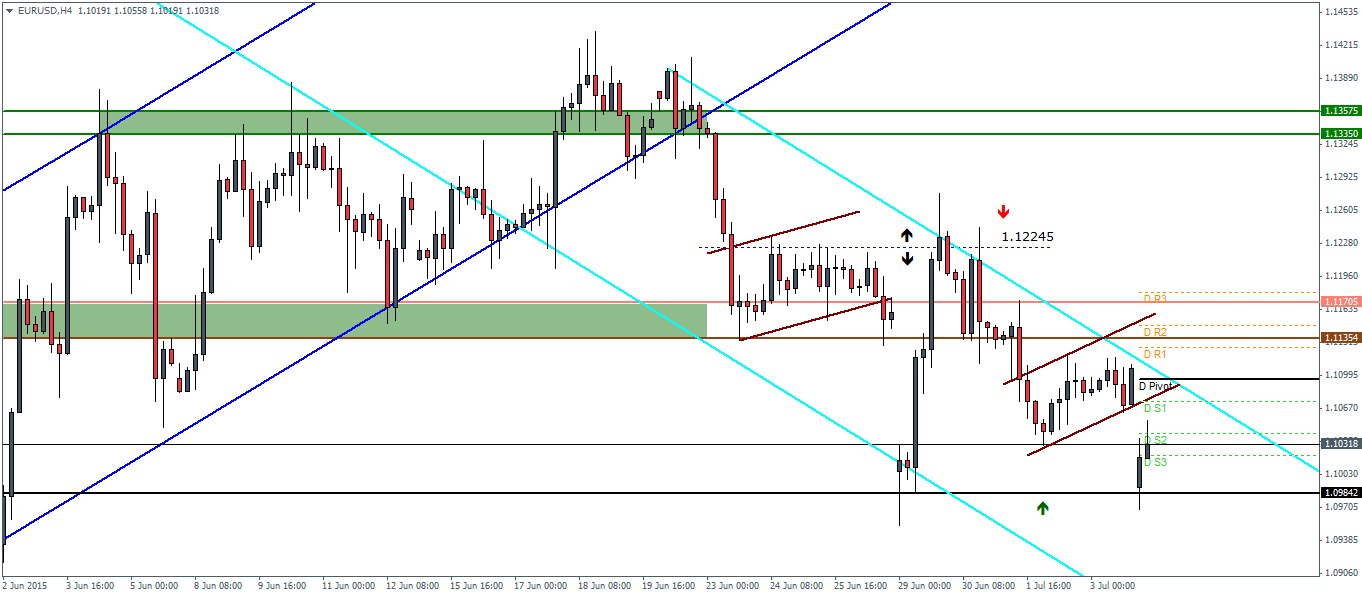

EURUSD (1.102): EURUSD gapped down on today’s open at 1.099 from Friday’s close of 1.1106 but has managed to recover some of that gap already on the daily charts. On the intraday charts, the bear flag pattern looks to be in play as we notice a breakdown of prices which saw support holding prices near 1.0985. The measured move of this bear flag gives a further downside projection to 1.0927. Failure to close below 1.095 could see EURUSD invalidate the bear flag pattern and set up for a potential break out from the falling price channel. Below 1.095, 1.082 comes in as the next technical support level.
USDJPY Daily Pivots
| R3 | 123.653 |
| R2 | 123.417 |
| R1 | 123.063 |
| Pivot | 122.827 |
| S1 | 122.486 |
| S2 | 122.25 |
| S3 | 121.909 |
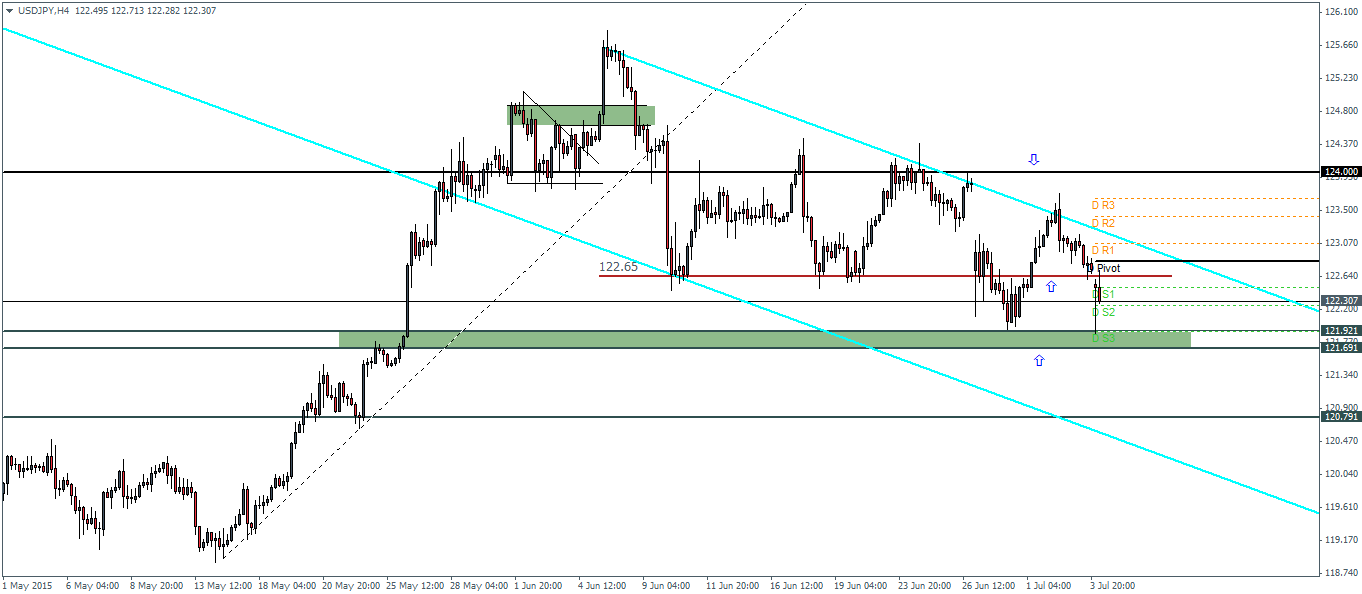
USDJPY (122.33): USDJPY also gapped down lower from Friday’s close and so far remains bearish. The shooting star pattern on Thursday is indicative of further downside moves in USDJPY. Previously, price managed to briefly test support at 122 and was rejected sharply. We expect a more clear test to 122 region, which if holds would keep the upside bias intact. Alternatively, if 122 support gives way, USDJPY could see a dip down to 120.8 support.
GBPUSD Daily Pivots
| R3 | 1.5713 |
| R2 | 1.5678 |
| R1 | 1.5631 |
| Pivot | 1.5596 |
| S1 | 1.555 |
| S2 | 1.5515 |
| S3 | 1.5469 |
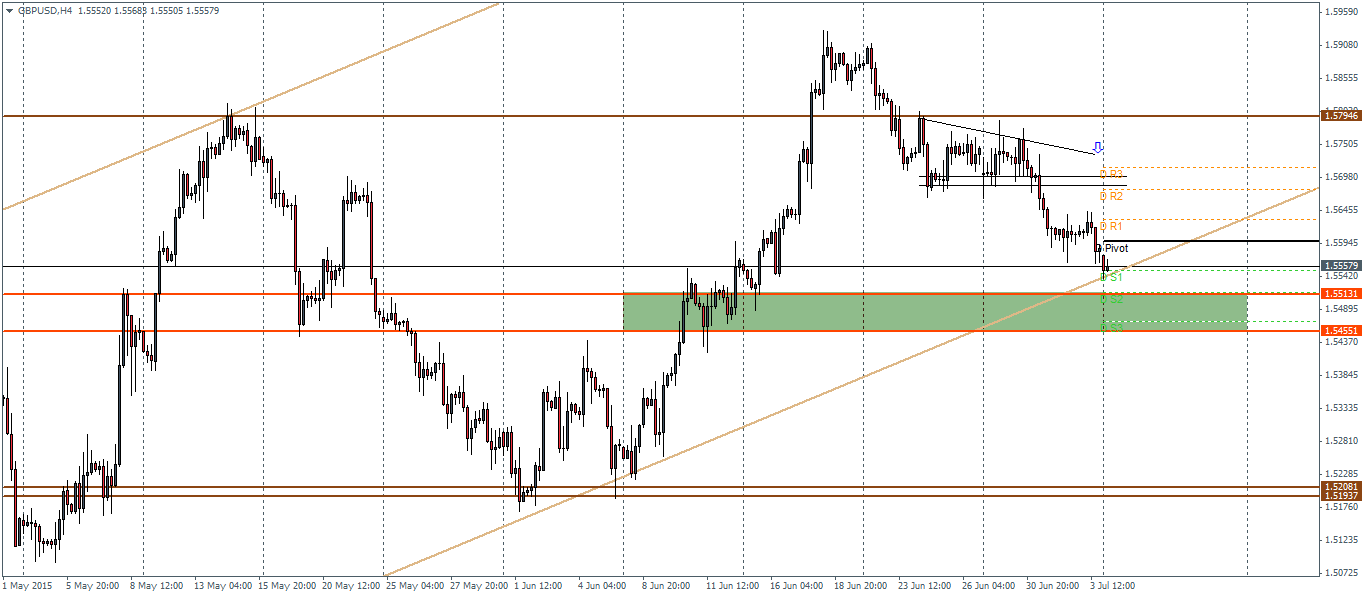
GBPUSD (1.555): GBPUSD continues to decline gradually with price now close to the lower rails of the rising price channel. There is a confluence of the horizontal support from the rising price channel and the horizontal support level near 1.551. If support holds here, GBPUSD could rally back. On the other hand, a break below 1.545 could see GBPUSD decline to 1.52 level of support. The current price action has completed the downside projected move in GBPUSD and therefore as long as price is above 1.551, we expect the uptrend to resume.

