
The US Dollar Index declined to lows below 93.70 as expected from our previous weekly analysis. Price saw a sharp reversal at this low and posted three straight days of gains, a correction to the decline which was much stronger than previous corrections and one that could well qualify to beg the question if we are starting to see a turnaround in the US Dollar Index.
So far economic data has been so-so and there are signs that the economy is slowly getting back on its feet especially from the housing sector. But with the exception of the housing market data, most of the other economic indicators have been relatively week, which makes it a bit difficult to gauge the market sentiment when it comes to the Greenback.
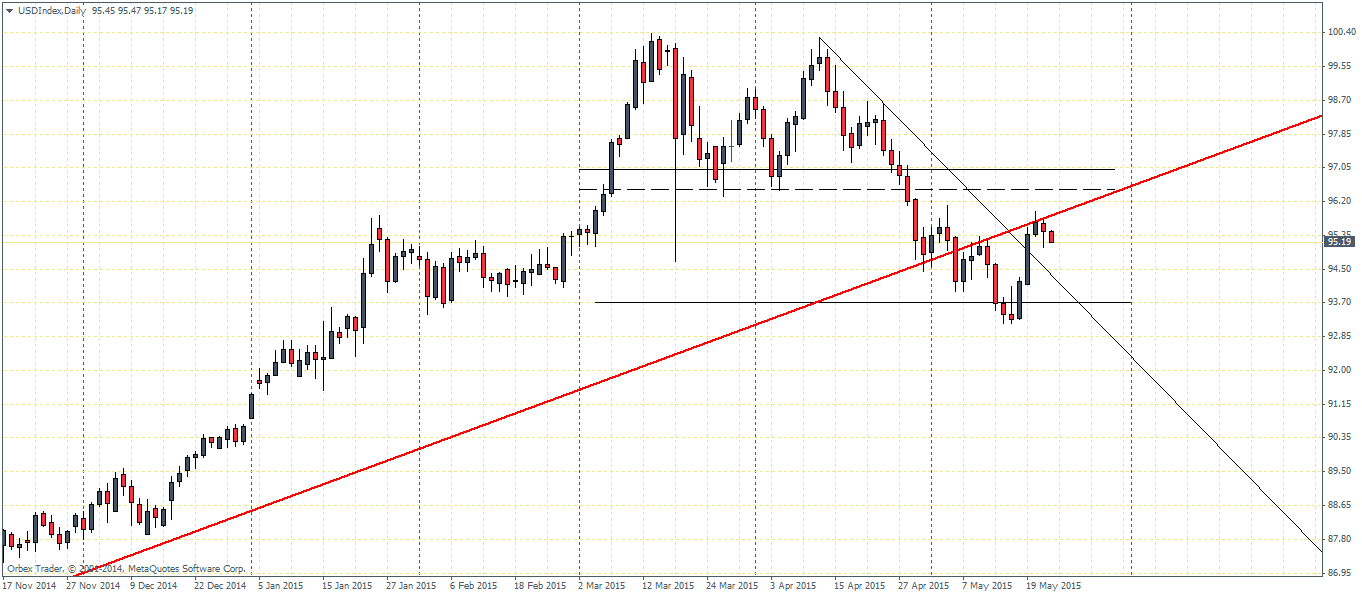
Technically, the daily charts shows price has broken a minor falling trend line on 19th May closing above 95.25 price point. We now see that yesterday closed bearish but still hold our short term view that prices could test the previously broken support near 97 through 96.5. This broken support could be established as resistance in the event price action holds above 94.5 which will see a retest near the break out level approximately which could then see a rally towards 96.5 price zone.
However, this view comes under threat as the recent rally was capped by a longer term rising trend line which after acting as support over the years has now come in as resistance. In this view, we could largely expect to see the highs and lows playing an important role. A break below 93.7 is essential for declines, while a break above 95.5 is required to see a test towards 96/5 through 97.

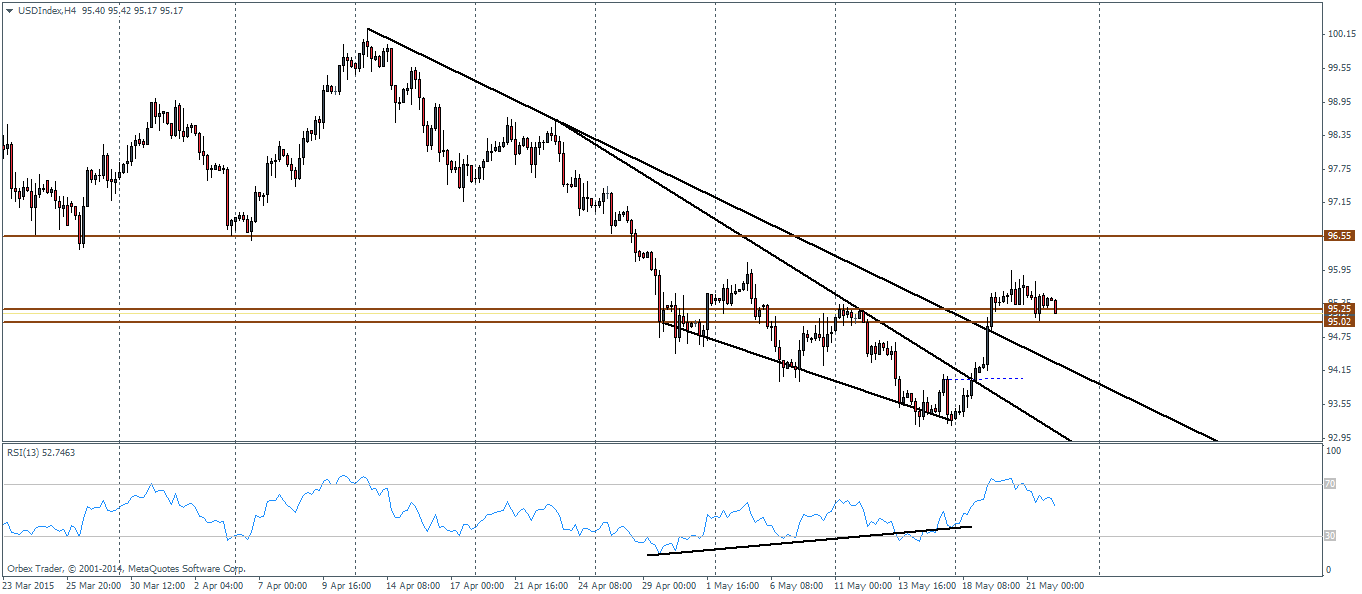
Switching to the 4 hour chart time frame, we can see why price rallied from the lows as RSI failed to confirm the declines and instead posted a bullish divergence. Price action rallied towards the previous support/resistance level between 95.25 through 95.0, briefly saw a bounce and a consolidation above this level and is currently back trading in the support zone.
Although price action has broken both the minor and short term falling trend lines, we will have to see support being established in order to test the highs at or above 96.5. Failure to hold prices near 95 could see a decline lower back to the previous break out at 94 which if fails could then see a steeper correction lower.
Today’s main risk comes from the monthly inflation data where the annualized CPI is expected to fall -0.2% on the headline, while unchanged at 1.7% on the Core. Most recent CPI data from other regions showed a sharp slowdown across the board and this negative bias could build into the markets in the run up to the CPI data release. The Fed does not consider the CPI numbers, but regardless we could expect to see the markets react.

![Credit Card 160×600 [EN]](https://assets.iorbex.com/blog/wp-content/uploads/2023/06/13144507/Blog-Banner_EN-Banner_160X600X2.webp)