
The US Dollar Index briefly touched the 100 psychological price level not breached from below since 1997, marking an important milestone for the Greenback. However, although this might be good news for Dollar Bulls, the big question on everyone’s mind is if the Greenback will continue to maintain its current bullish momentum and steam roll further on.
It is essential to understand that the brief touch to 100 comes just days ahead of the Fed’s March FOMC meeting. The markets are convinced that with another strong jobs report in February, the Fed is very likely to remove the word “patient” from its language and set the stage for a rate hike in June or September this year.
Over the past few days, some of the Fed members gave speeches with a main theme being a call for interest rate hikes this year and also the optimism that inflation could hit the Fed’s target of 2% sooner in the next few months. Given the above positive remarks, it is no wonder the US Dollar simply kept chugging along with little to insignificant pullbacks in its rally. But the touch to 100 brings out another story.
The Weekly chart for US Dollar Index shows (to the extreme left) how price reacted to this level. Despite the price action in 1997 showing a decent pullback and forming support near the 94.8 region, it took quite a few attempts to break out from this resistance level. The last time the Dollar Index was at the 100 level region was in late 2003, where price managed to briefly form a resistance before dropping.

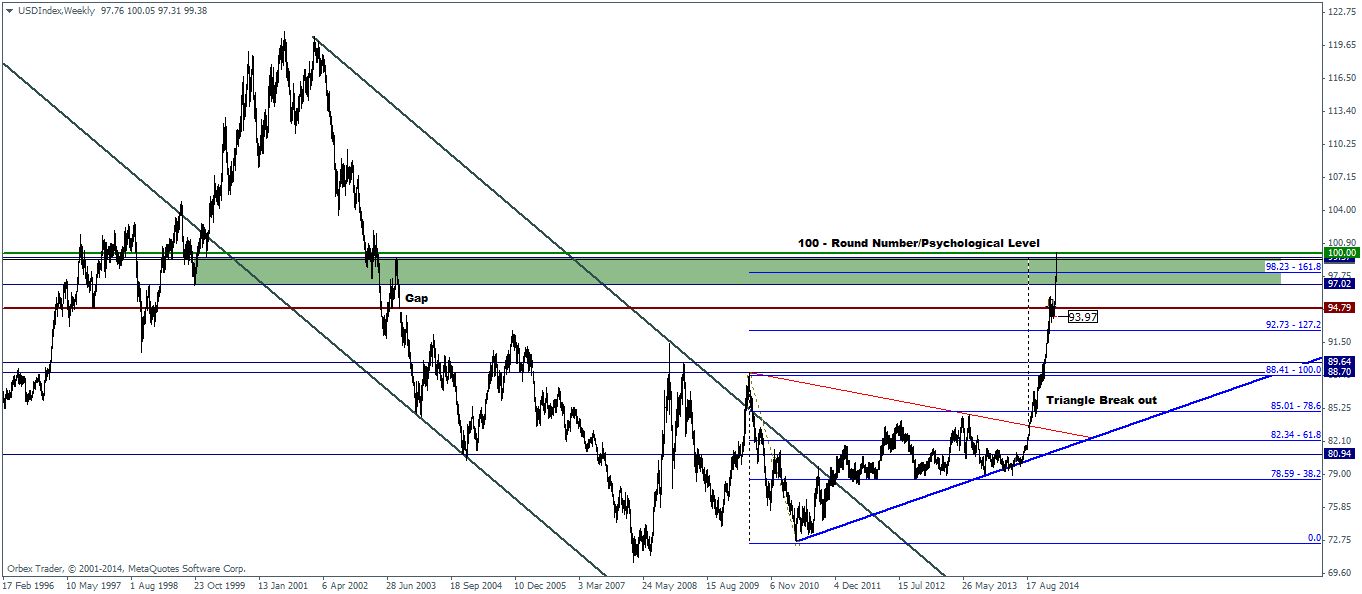
In the current times, we note that support is likely to come down at 94.8 through 94 levels which would make this a logical correction and also prepare the Greenback to take out the resistance level at 100.
In the above weekly charts, we also note that the current rally marks a measured move from the break out of the triangle pattern formed, which indicates that price action is very likely to see a correction sooner than later.
Of importance will be the factor of timing, which coincides with the Fed’s meeting next week. Until then, we could expect the Greenback to consolidate or move sideways, while waiting for further clues from the Fed next week.
A hawkish outlook could most likely see the Greenback edge higher and probably towards 101/102 levels but given that the expectations for a rate hike keep driving the Greenback higher, we could probably see a consolidation start for the longer term until the Fed actually signals a rate hike.
Regardless of the outcome from next week’s FOMC, the US Dollar Index technical charts point to the fact that the bullish momentum is likely to fade near 100 through 102 resistance levels. A continued rally above these levels would indicate a strong correction that could build up sooner than later.
In conclusion, it would be best to remain cautious on the Dollar Index and long dollar positions ahead of next week’s FOMC and also in the near term.

![Credit Card 160×600 [EN]](https://assets.iorbex.com/blog/wp-content/uploads/2023/06/13144507/Blog-Banner_EN-Banner_160X600X2.webp)