
Gold & Silver Technical Outlook
Gold Futures – Technical Update
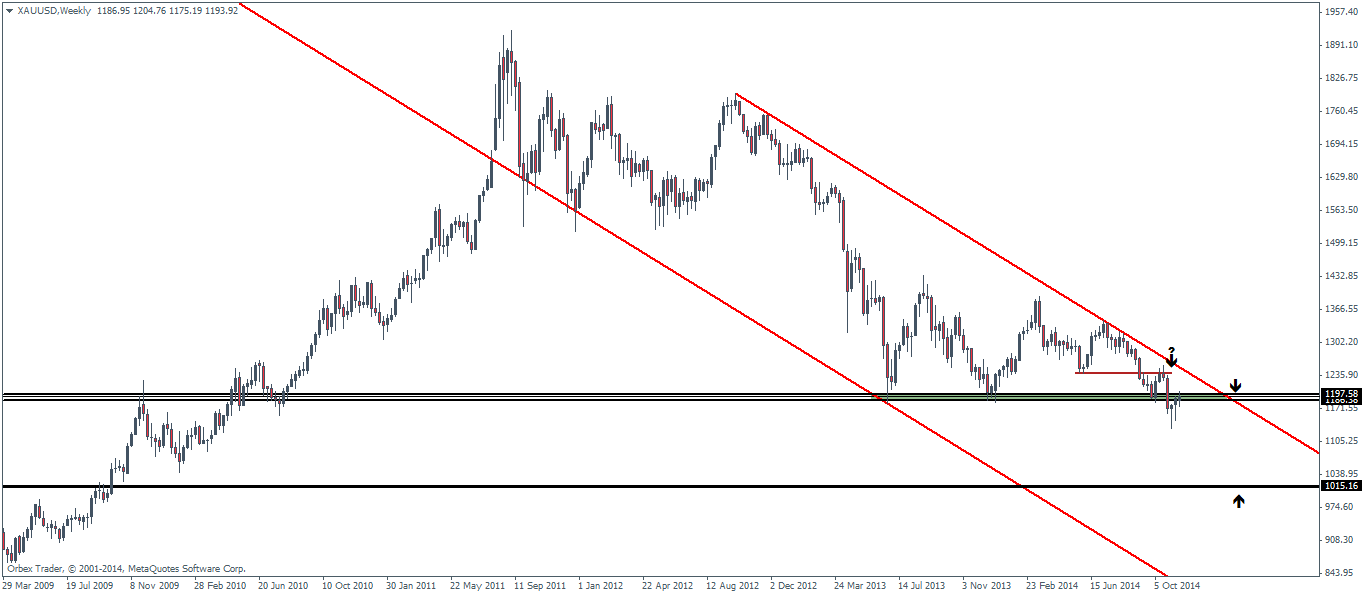
Gold futures seemingly performed well this past week considering the key risk this week was the FOMC meeting minutes. As noted in our last week’s analysis of Gold futures, price managed to reverse its losses to head back to the main level of 1186 – 1200 handle and in the process creating sharp reversal pin bar candlestick patterns. A break above 1200 for a weekly close could potentially make way for a retest to the minor support level that was briefly retested for resistance at 1239/1240 region. Overall, Gold futures continue to remain bearish and next week will be critical for this precious metal as the Swiss referendum, an initiative to bring back Gold to Switzerland gets underway.
Last week opinion poll released showed that there was still no majority for this initiative, something that has provided temporary relief to the Swiss National Bank, where seemingly the peg of 1.20 for the EURCHF continues to be questioned.

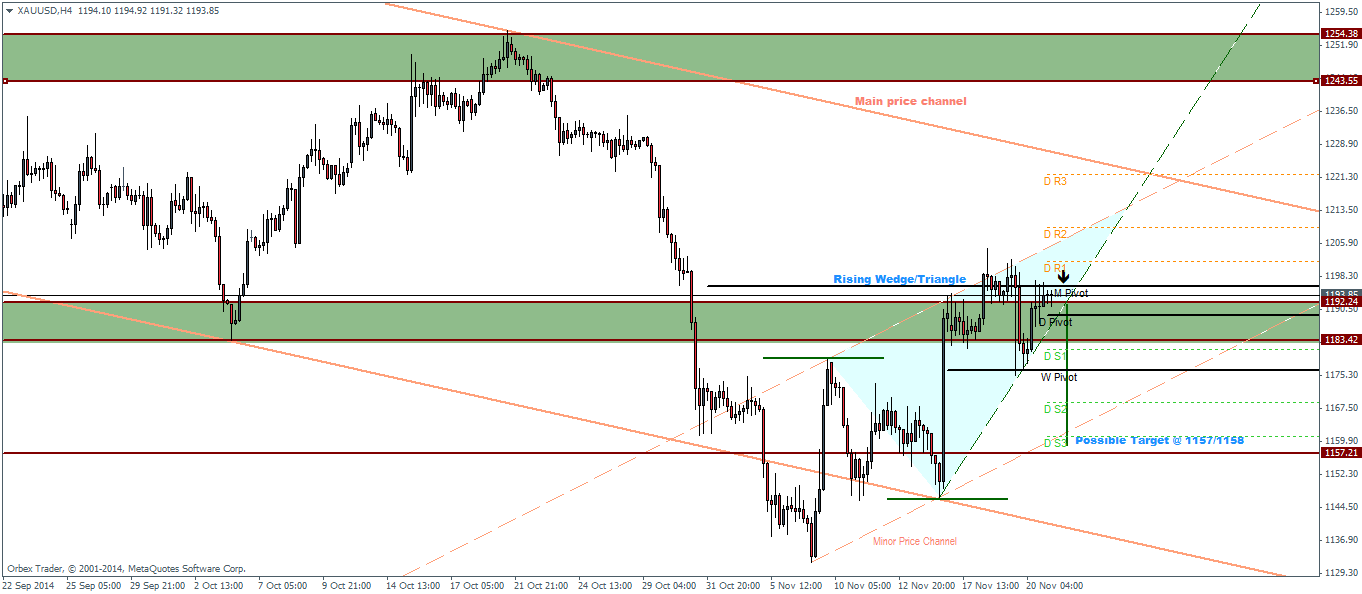
The intra-day charts perhaps shed more light into the direction for Gold. The H4 chart below shows the H4 major price channel which is sloping downwards and in tune with the major bearish trend. The minor price channel however is sloping counter trend as price currently sits within the key support/resistance area. We also notice a rising wedge/triangle pattern being formed here which gives a possible downside objective towards 1157/1158 levels, which shows a confluence to the minor price channel’s lower support line along with the daily support level 3 region.
Gold Pivot Levels
| R3 | R2 | R1 | Pivot | S1 | S2 | S3 | |
| Weekly | 1254.38 | 1223.96 | 1206.79 | 1176.52 | 1159.35 | 1129.08 | 1111.91 |
| Daily | 1221.8 | 1209.49 | 1201.6 | 1189.06 | 1181.17 | 1168.87 | 1160.97 |
Silver Futures – Technical Update
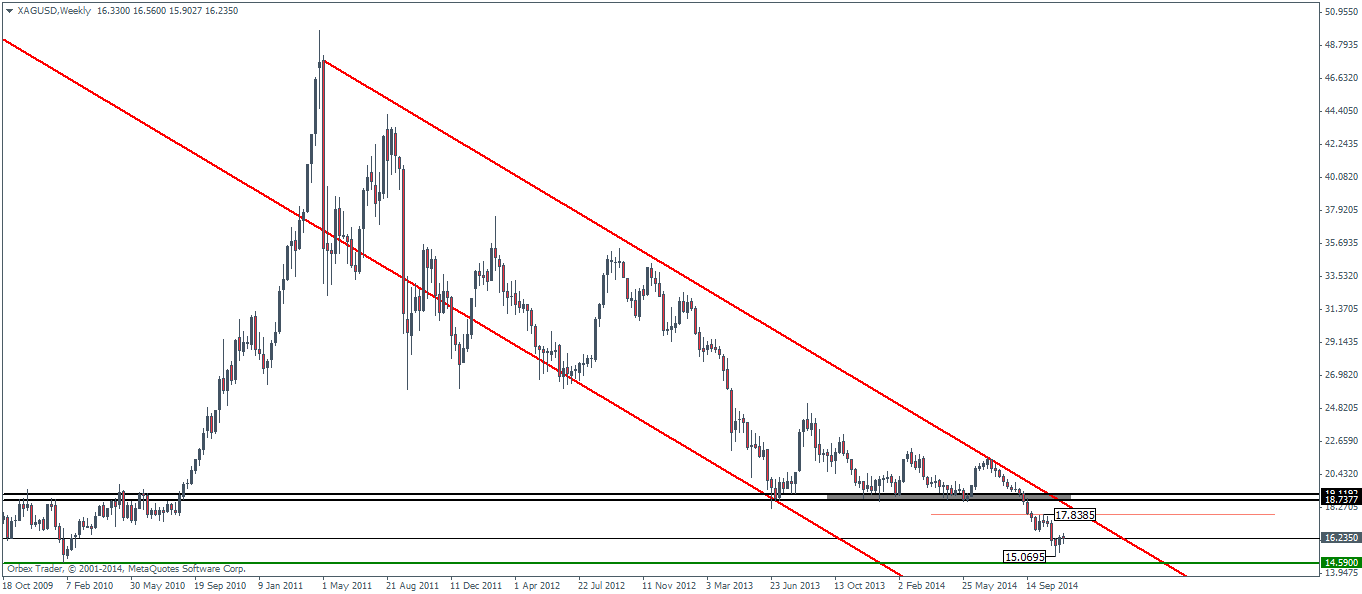
Silver futures saw a reversal last week, posting a higher low and a minor higher high relative to the previous week. The fact that we see these reversal signs just near the 14.59 support level is indicative of a possible rally back to 18.73 in the long term. However, for this to happen, Silver futures would have to break above the minor highs of 17.77. Considering the price action is trading close to the price channel, we could expect to see some consolidation taking shape potentially making way for a week of either massive gains or declines. We should also point out that the closer price action gets to the price channel, the more likely that there could be a break out to the upside.
With only a week left, the monthly charts show Silver futures reversing its losses and at the time of writing, the monthly candle is forming a doji. Potentially, if next week sees any upside gains in Silver prices, this could turn the November’s monthly candlestick into a bullish piercing line pattern and could set the stage for a rally towards 18.80 regions, the longer term support level that was broken, which could be tested for resistance. Alternatively, should prices decline next week; we will see a 6th month of consecutive decline in Silver and depending on where prices close (which is unlikely to drop below 15 next week) it is still indicative that the bearish momentum is waning.
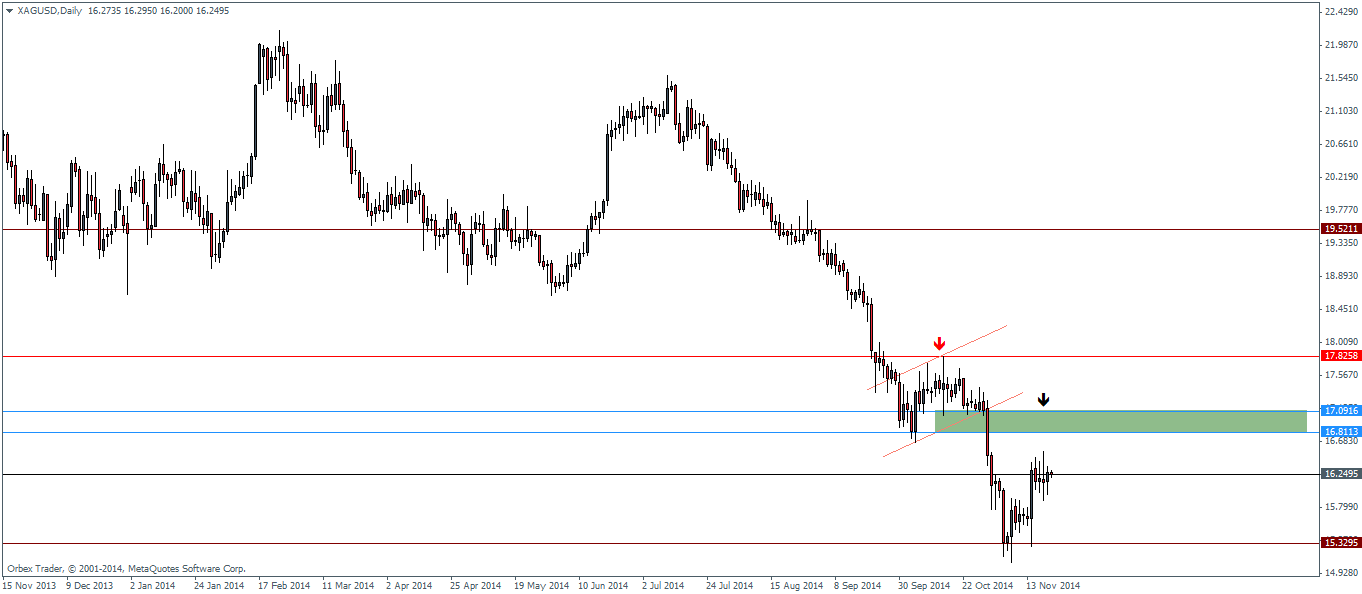
The daily charts for Silver does however point to the current reversal being only temporary. The bearish flag that has been formed is currently seeing prices rally back to retest the break out levels between 17 – 16.8 area. A successful test of this level without any further rallies could see Silver turn over to decline back to the first target of 15.32 followed by 14.5 (the objective from the weekly time frame).
Silver Pivot Levels
| R3 | R2 | R1 | Pivot | S1 | S2 | S3 | |
| Weekly | 17.83 | 17.11 | 16.71 | 15.99 | 15.58 | 14.87 | 14.46 |
| Daily | 16.79 | 16.57 | 16.42 | 16.19 | 16.04 | 15.82 | 15.67 |

