Gold Futures – Technical Update
Gold futures bounced back from last week’s low of 1132 to form a sharp pin bar rejection candlestick pattern. Unless we see a lower close below 1132, Gold futures could be moving into a sideways price action ahead of the FOMC meeting minutes, due to be released on the 19th, next Wednesday. From the updated chart below, we can see that the broken support level is yet to be tested at 1186 – 1200 handle. The daily charts show price action heading into a tight consolidation phase which is indicative of an impending volatile break out.
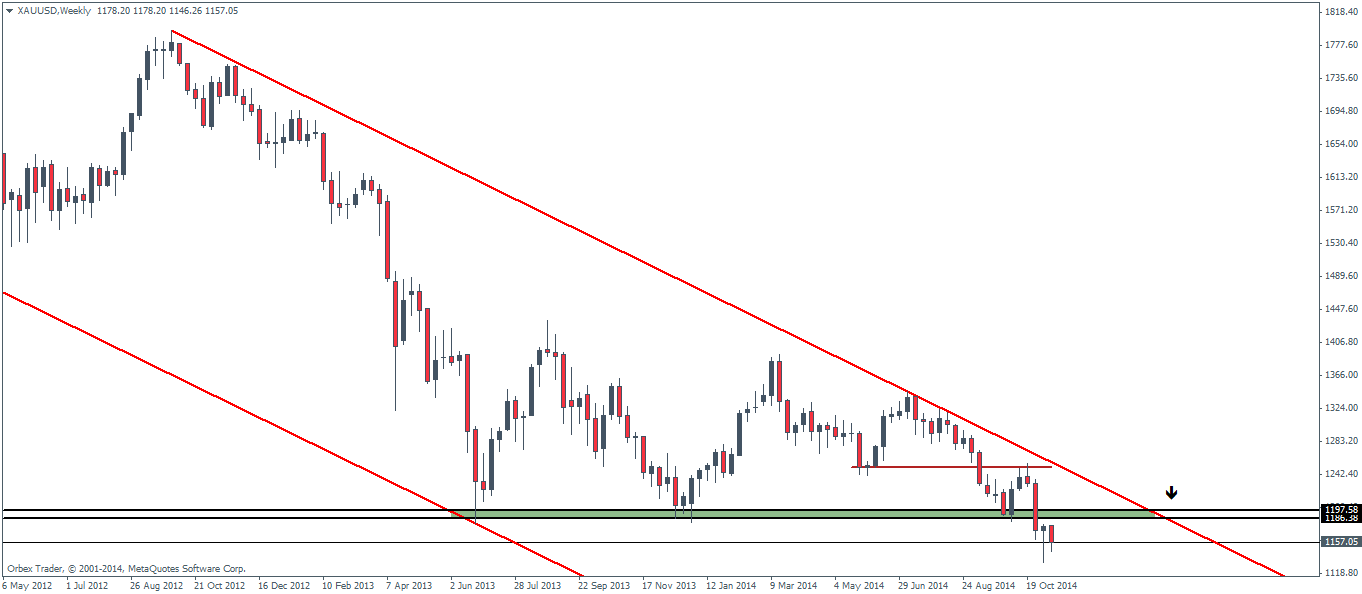
Geo-politically there hasn’t been much of any risk-averse news which has managed to keep the Gold futures prices subdued. However, the talk of the town has been the Swiss Referendum on Gold. The ‘Save our Gold’ campaign aims to put into law, a ban on selling Swiss Gold as well as repatriation of the Swiss Gold holdings with the total Gold accounting for close to 20% of the SNB’s assets. Opinion polls are however showing waning support, but in the event the vote does pass through, it could send ripples through the Fx markets and put to question the SNB’s peg on the 1.20 EURCHF floor.

While the referendum is due for voting towards the end of November, for the interim, key fundamental risks to the Gold futures come with today’s US retail sales data and next week’s FOMC minutes. Unlike the previous Fed’s meeting where the markets misread the FOMC statement only to realize the dovish statement when the minutes were released, last month’s Federal Reserve statement was quite hawkish without any undertones of dovish outlook, which should be supportive of the US Dollar while putting downward pressure on Gold.
Gold Pivot Levels
| R3 | R2 | R1 | Pivot | S1 | S2 | S3 | |
| Weekly | 1240.08 | 1209.49 | 1193.05 | 1162.46 | 1146.02 | 1115.43 | 1098.99 |
| Daily | 1183.03 | 1175.37 | 1168.87 | 1161.44 | 1154.93 | 1147.51 | 1140.77 |
Silver Futures – Technical Update
Silver futures drifted gradually and looks imminent for the descending triangle’s target of 14.59 to be reached. We could probably see a bounce from the 14.59 level but the question remains whether the bounce will see a rally back to test the broken support at 18.73 for resistance before prices can drop further beyond the 14.59 handle. Not shown on chart, the H4 time frame is currently shaping out to be a bearish flag pattern with the likelihood of a test back to 15.50 which could result in a break down to 15 followed by 13.30 coming in as the final objective.
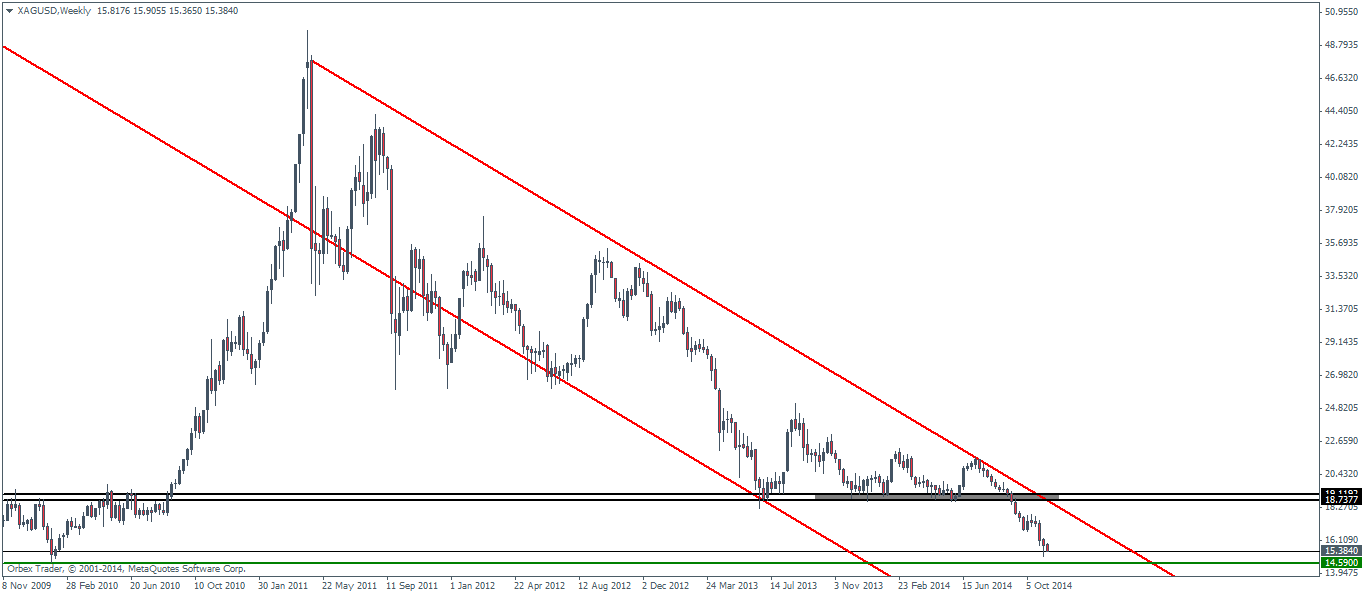
The monthly charts of Silver however paints a very bearish longer term view with the possibility of Silver to further decline towards 9.84 handle which is a major multi-year support level. If Silver closes lower this month, it would mark a fifth consecutive month of losses for Silver while highlighting the fact that a pullback could be around the corner with the potential to test back to the longer term broken support at 18.79.
Silver Pivot Levels
| R3 | R2 | R1 | Pivot | S1 | S2 | S3 | |
| Weekly | 17.48 | 16.86 | 16.31 | 15.69 | 15.14 | 14.51 | 13.96 |
| Daily | 16.02 | 15.9 | 15.78 | 15.67 | 15.54 | 15.43 | 15.31 |

![Credit Card 160×600 [EN]](https://assets.iorbex.com/blog/wp-content/uploads/2023/06/13144507/Blog-Banner_EN-Banner_160X600X2.webp)