
The Donchian channels trading indicator is a type of an envelope indicator with bands that envelope price which moves at a fixed period high and low.
Donchian channels indicator is attributed to the famous Richard Donchian who is considered to be one of the pioneers in trend timing and trend following analysis.
Richard Donchian had many achievements which included Futures Inc., the first publicly managed futures fund that he launched. Donchian channels shot to prominence after the Turtle Trading experiment by Richard Dennis and William Eckhardt.
Most of the turtle trading rules draw inspiration from Richard Donchian himself, who advocated that trading should be a mix of technical indicators, money management and psychology, which is basically the gist from his 20 rules of trading.

What is the Donchian Channel Indicator?
The Donchian channel indicator consists of an envelope with upper and lower bands and a middle band. The indicator plots a 20-period default high and low price band with the middle band showing the average of the two.
The three lines combine what is called as a Donchian channel. It sounds very simple so far, and it really is.
The chart below shows the 20-period Donchian channel applied to the daily chart of the EURUSD.
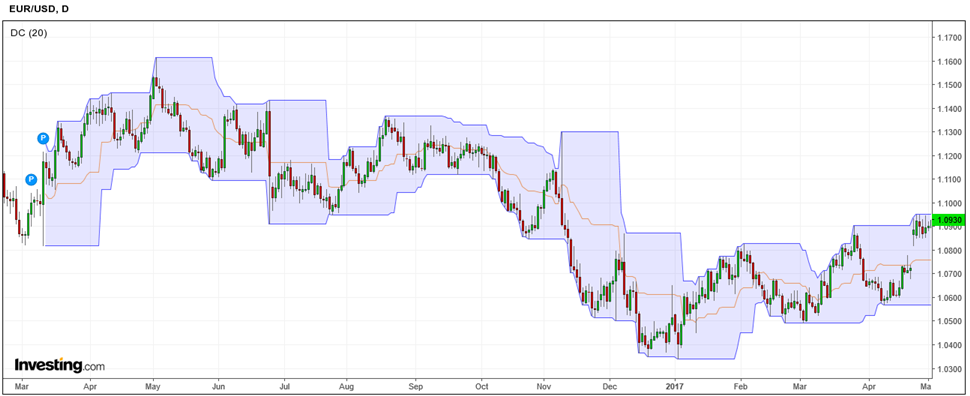
The Donchian channel is ideal to represent trends and also ranging markets. However, it does lack in showing volatility (unlike Bollinger bands). The trading rules for Donchian channels are quite simple.
Sell the break out when the price falls below the 20-period low or buy the break out when the price rises above the 20-day high.
The following chart illustrates a buy and a sell example on the breakout from the Donchian channel.
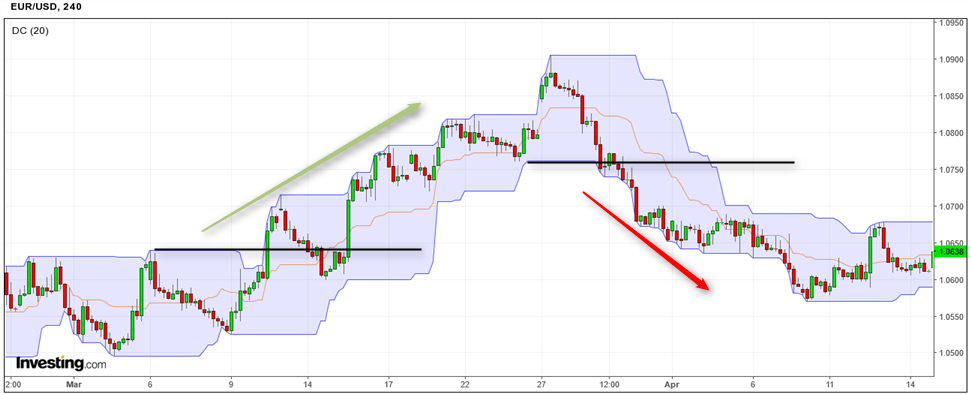
An important point to note here is that when we refer to a Donchian channel breakout, we simply mean the breakout from the past 20-period high or low. Unlike Bollinger bands where the price can be seen piercing through the upper or the lower bands, this is not the case with Donchian channels as the upper and lower lines is simply 20-period high and low.
Thus, there is no price breakout but rather a breakout from the previous 20-period high or low.
The Turtle trading rules employ a similar technique of trading, but they also bring in additional money management which helps traders to maximize the winning trades.
Of course, there are many different ways to trade with the Donchian channel indicator than just breakouts.
How can you use the Donchian channels?
There are a number of strategies that can be used with Donchian channels, including trend following and breakout trading methods.
Here are two ways that the Donchian channel can be put to use:
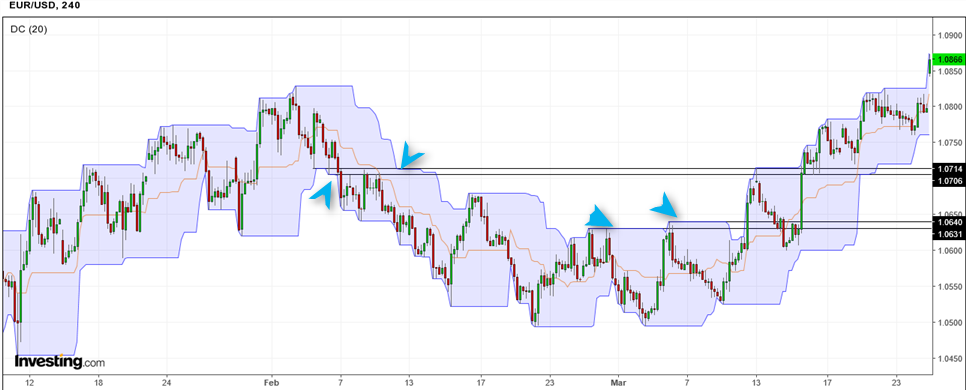
Support and resistance
The Donchian channels’ high and low bands are a great way to identify support and resistance levels. When the bands are straight, that price level is often stronger as a support or a resistance level. In fact look at any Donchian channel chart and the chances are that price reacts strongly to such levels in the first instance.
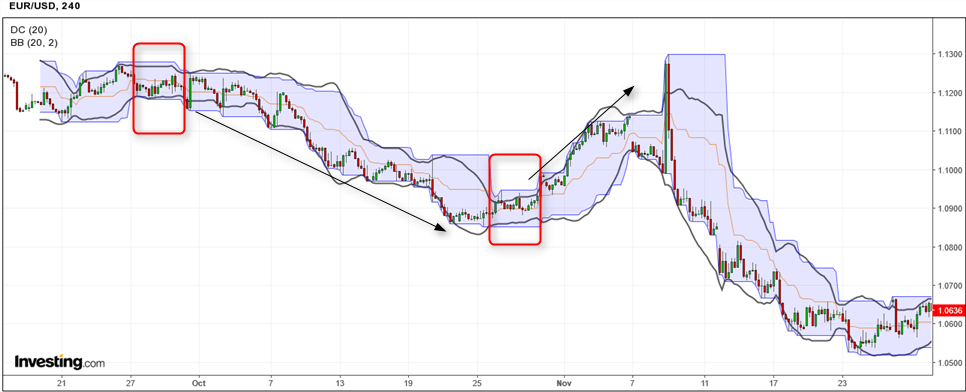
Bollinger band and Donchian Channel squeeze
The Bollinger bands and Donchian channels combination is another popular way of trading. With this combination of indicators, the Bollinger bands signal rising and falling volatility while the Donchian channels serve as a breakout indicator.
When the Bollinger band contracts within the Donchian channel, it signals a volatile breakout signal. Depending on which way the breakout is triggered, the position can be taken and maintained to ride the trend.
Why should you use the Donchian channel indicator?
The Donchian channel indicator is a relatively simple technical indicator that only plots visually the 20-period high and low prices. Based on the breakout from the high or low levels, traders can devise various trend-following or break out based trading strategies.

