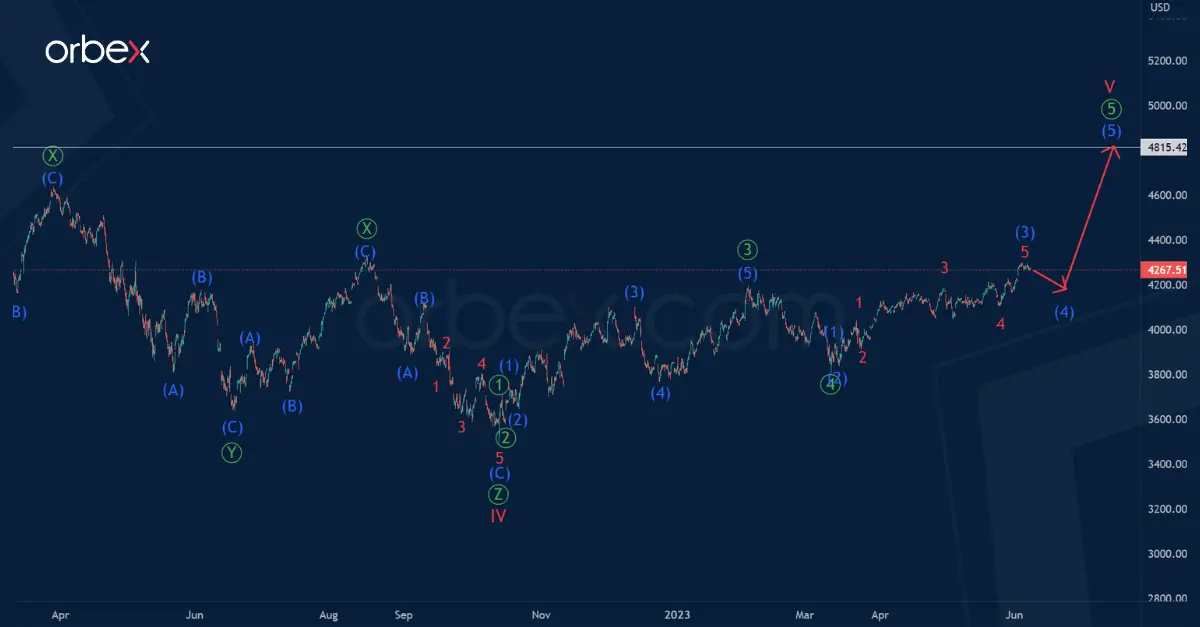
As three weeks ago, the SPX500 index continues to form a large impulse trend consisting of sub-waves I-II-III-IV–V.
Last autumn, a long cycle correction IV was completed in the form of a primary triple zigzag. Then the price began to creep up, building a cycle fifth wave.
Four parts have been completed as part of impulse V to date. In the near future, the market could move up to a maximum of 4815.42 in the subwaves (4)-(5), which was marked by the cycle impulse wave III.

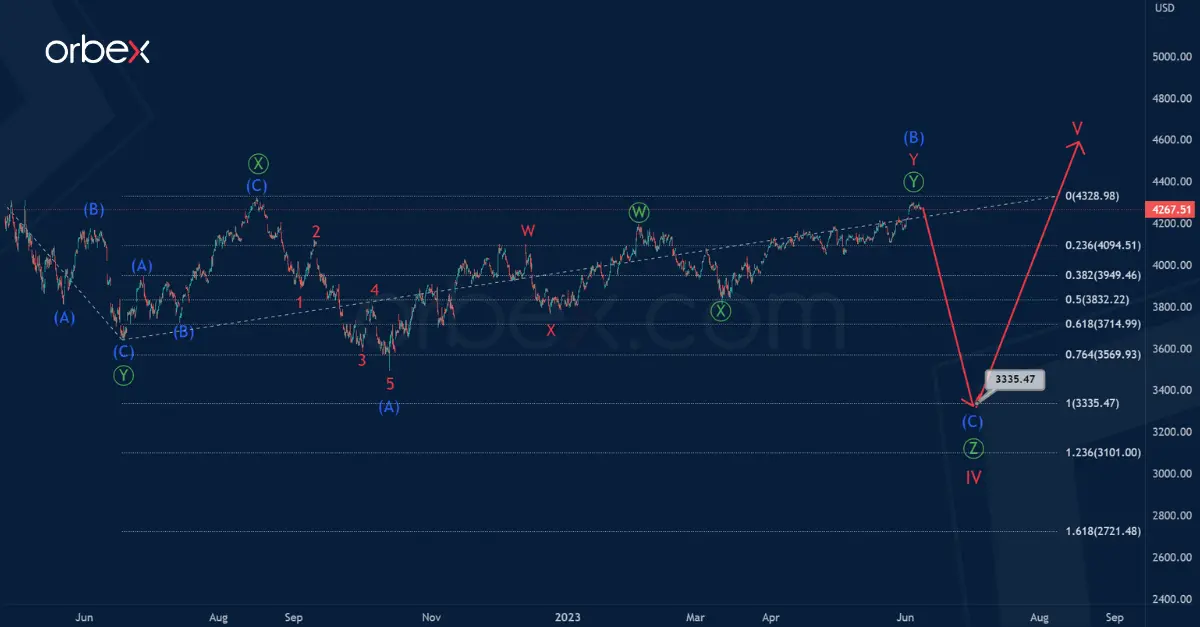
And what if the construction of correction IV is not completed? We suggest considering an alternative scenario. Perhaps the actionary wave Ⓩ tends to equality with the wave Ⓨ.
In the upcoming trading days, the value could fall to the price mark of 3335.47, at which the sub-waves Ⓩ and Ⓨ will be equal to each other.
The bearish intermediate wave (C) could take the form of a simple impulse.

