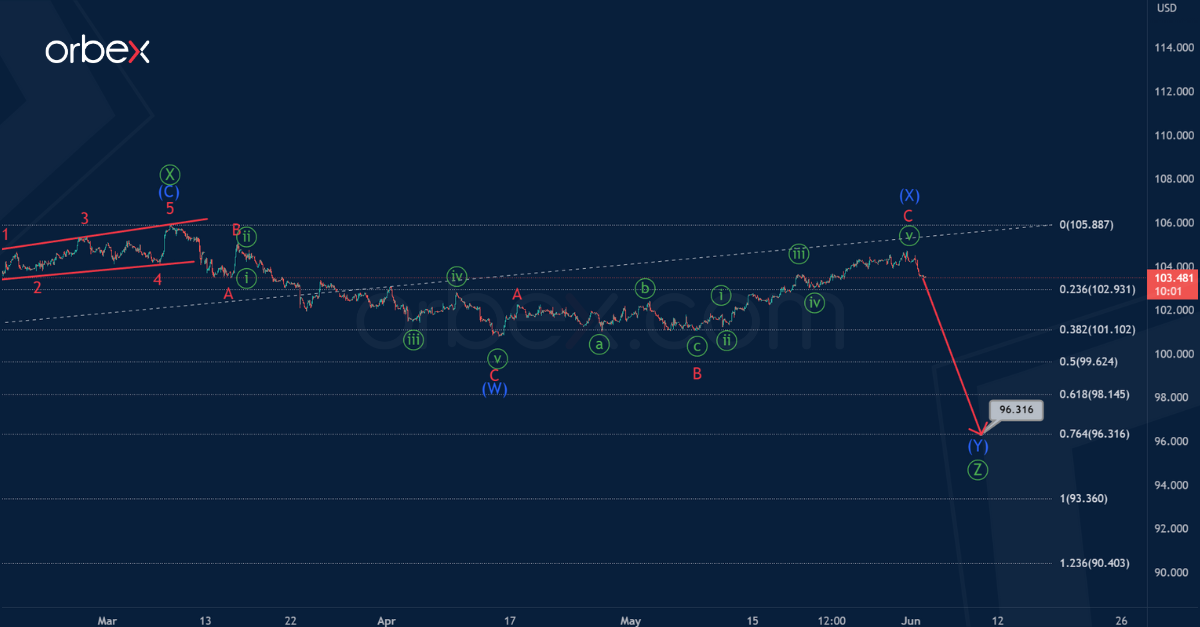
In the long term, the dollar index forms a triple zigzag pattern consisting of primary sub-waves Ⓦ-Ⓧ-Ⓨ-Ⓧ-Ⓩ. At the moment, the sub-waves Ⓦ-Ⓧ-Ⓨ-Ⓧ look complete. The second intervening wave Ⓧ is a standard zigzag.
Most likely, the price drop in the primary wave Ⓩ will continue in the coming days. Judging by the internal structure, this wave can take the form of an intermediate double zigzag.
The end of the bearish pattern is expected near 96.364. At that level, primary wave Ⓩ will be at 76.4% of wave Ⓨ.

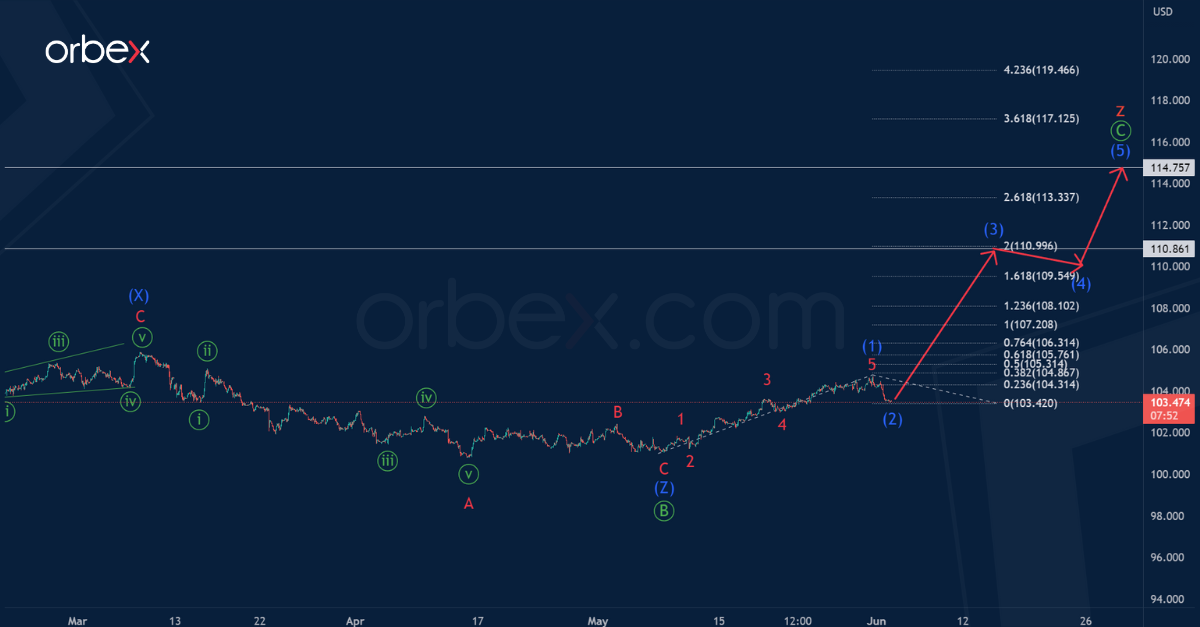
We propose to consider an alternative scenario in which a wave z is formed in a triple zigzag w-x-y-x-z.
The structure of the wave z is similar to the zigzag Ⓐ-Ⓑ-Ⓒ. In it, the first impulse Ⓐ and the correction Ⓑ in the form of an intermediate double zigzag have ended. The entire wave z can end near 114.75 at the maximum of the primary impulse wave Ⓐ.
However, the first target where the bulls will go is the maximum of 105.94, which was marked by the intermediate intervening wave (X).

![Credit Card 160×600 [EN]](https://assets.iorbex.com/blog/wp-content/uploads/2023/06/13144507/Blog-Banner_EN-Banner_160X600X2.webp)