
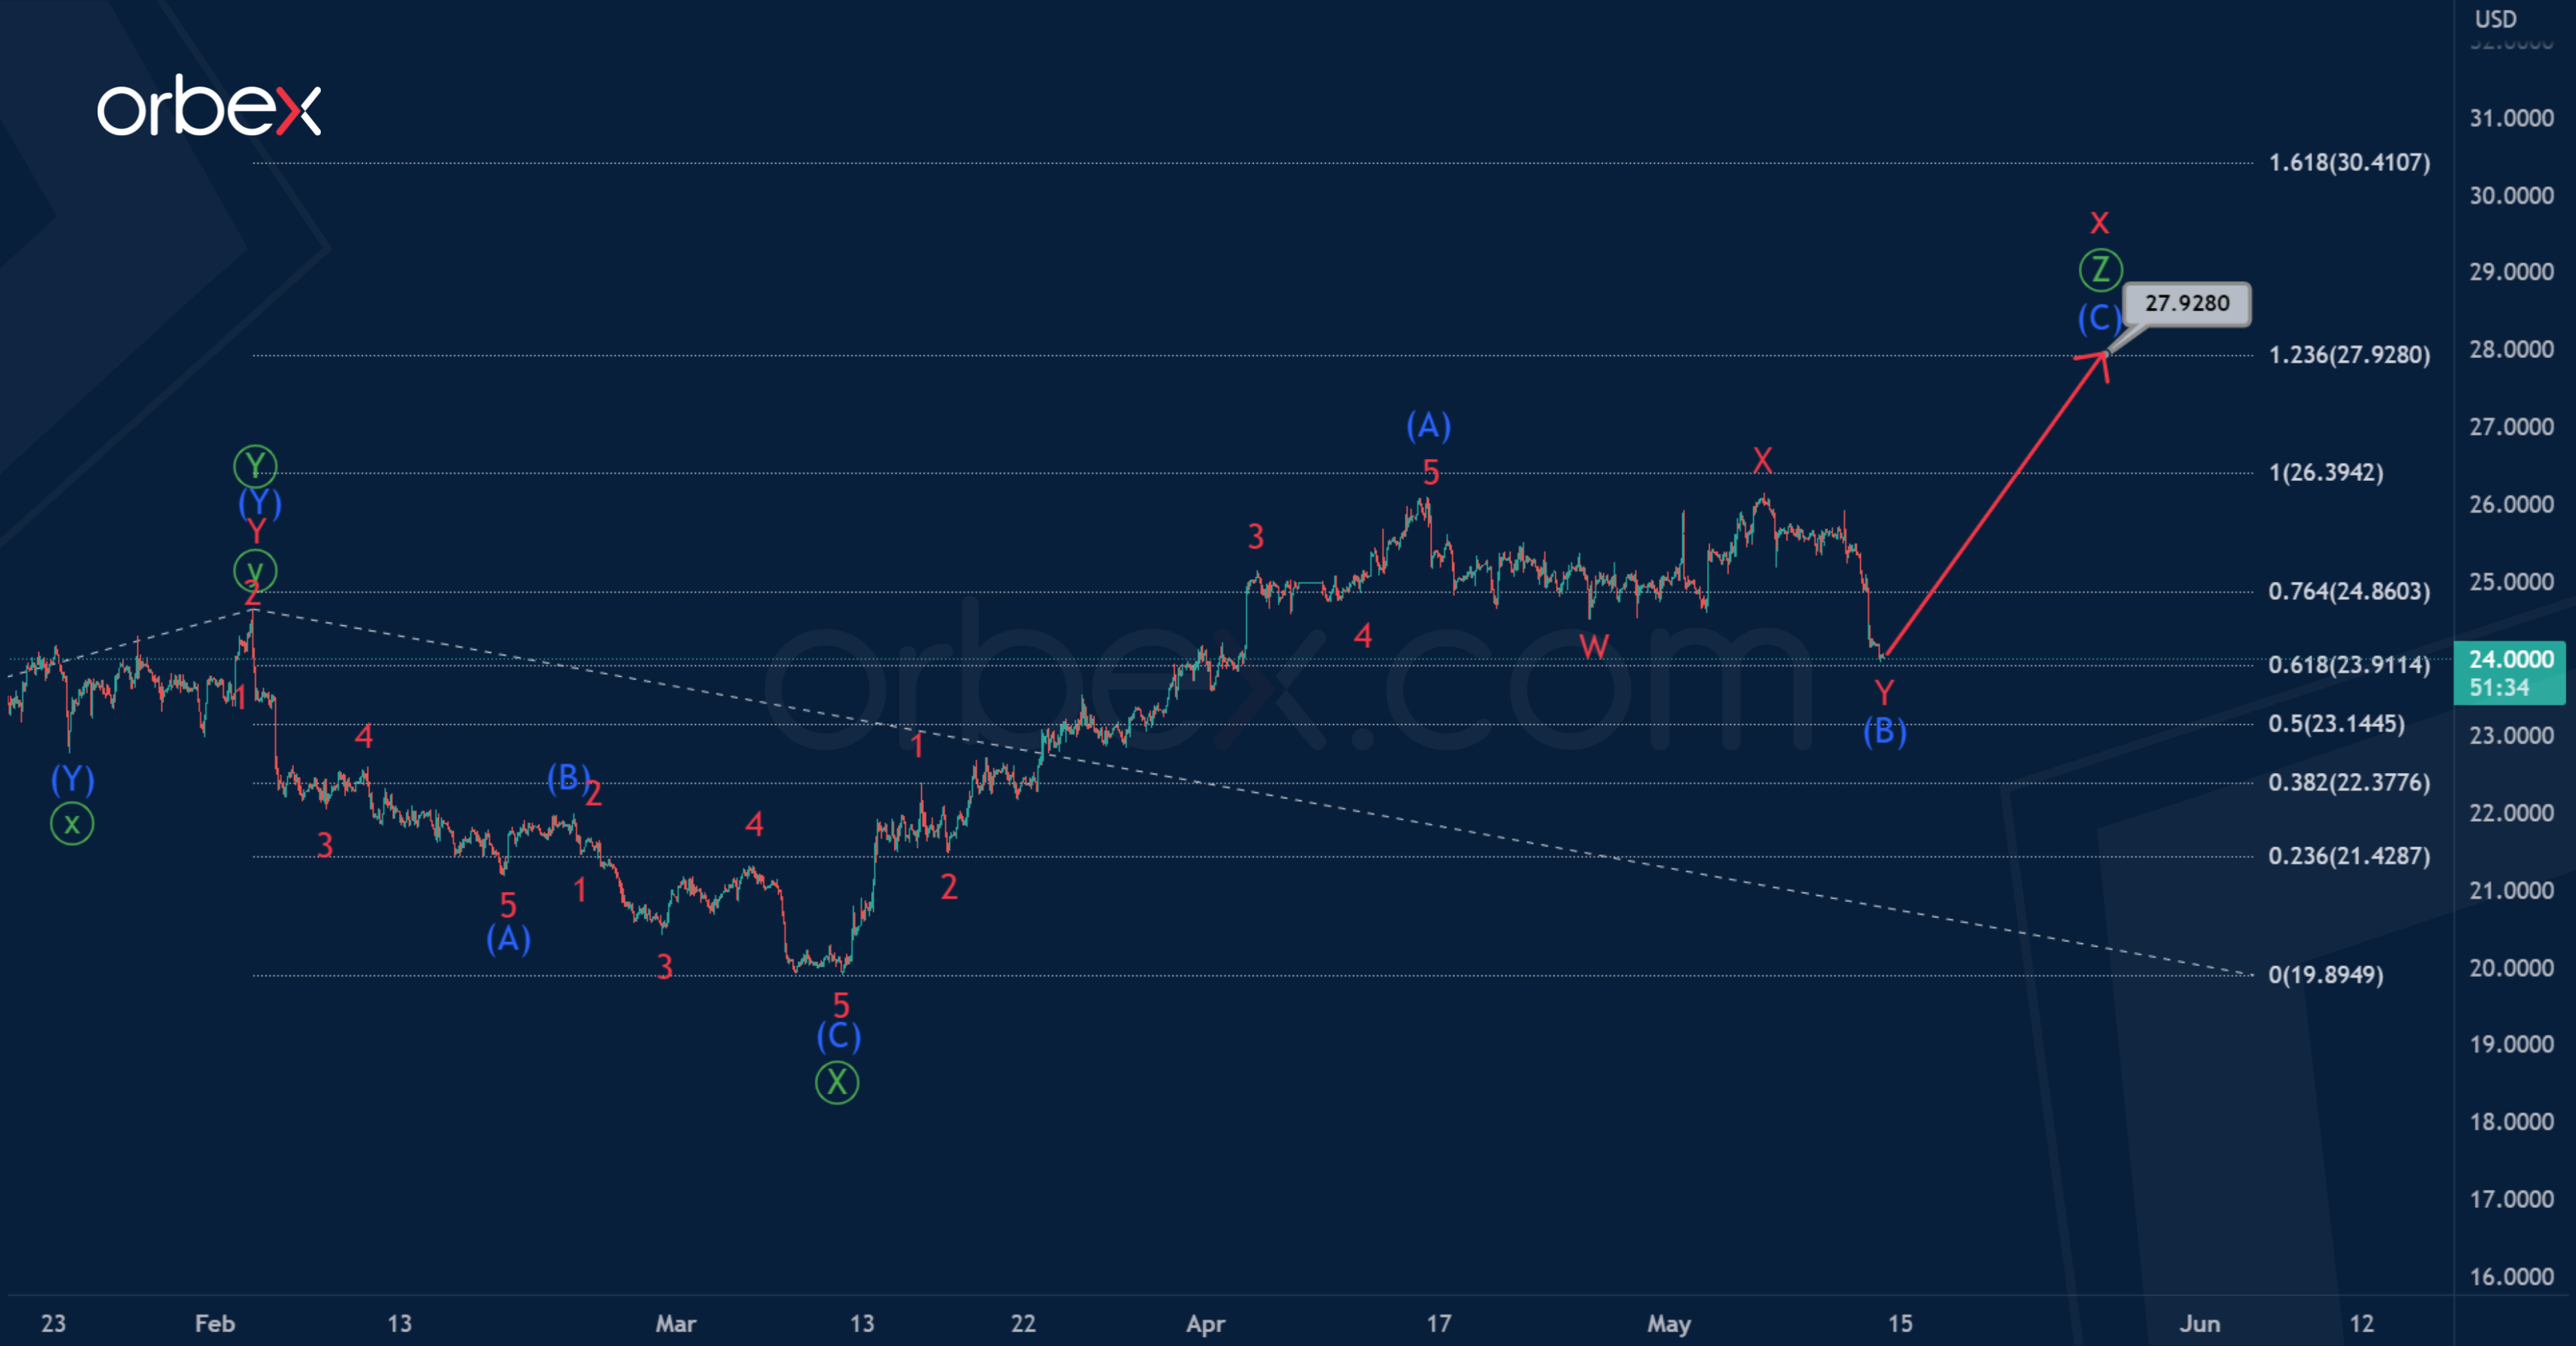
It is assumed that silver is moving inside the global corrective trend consisting of cycle waves w-x-y-x-z.
The current chart H1 shows the structure of the cycle intervening wave x. This could end as a triple zigzag of the primary degree Ⓦ-Ⓧ-Ⓨ-Ⓧ-Ⓩ.
At the moment, the price could be in the primary wave Ⓩ. Perhaps this wave will be a standard zigzag, where the impulse and correction have ended. Wave (B) is a double zigzag.

In the near future, growth is expected in (C) approximately to 27.928, where the primary waves Ⓩ and Ⓨ will be equal.
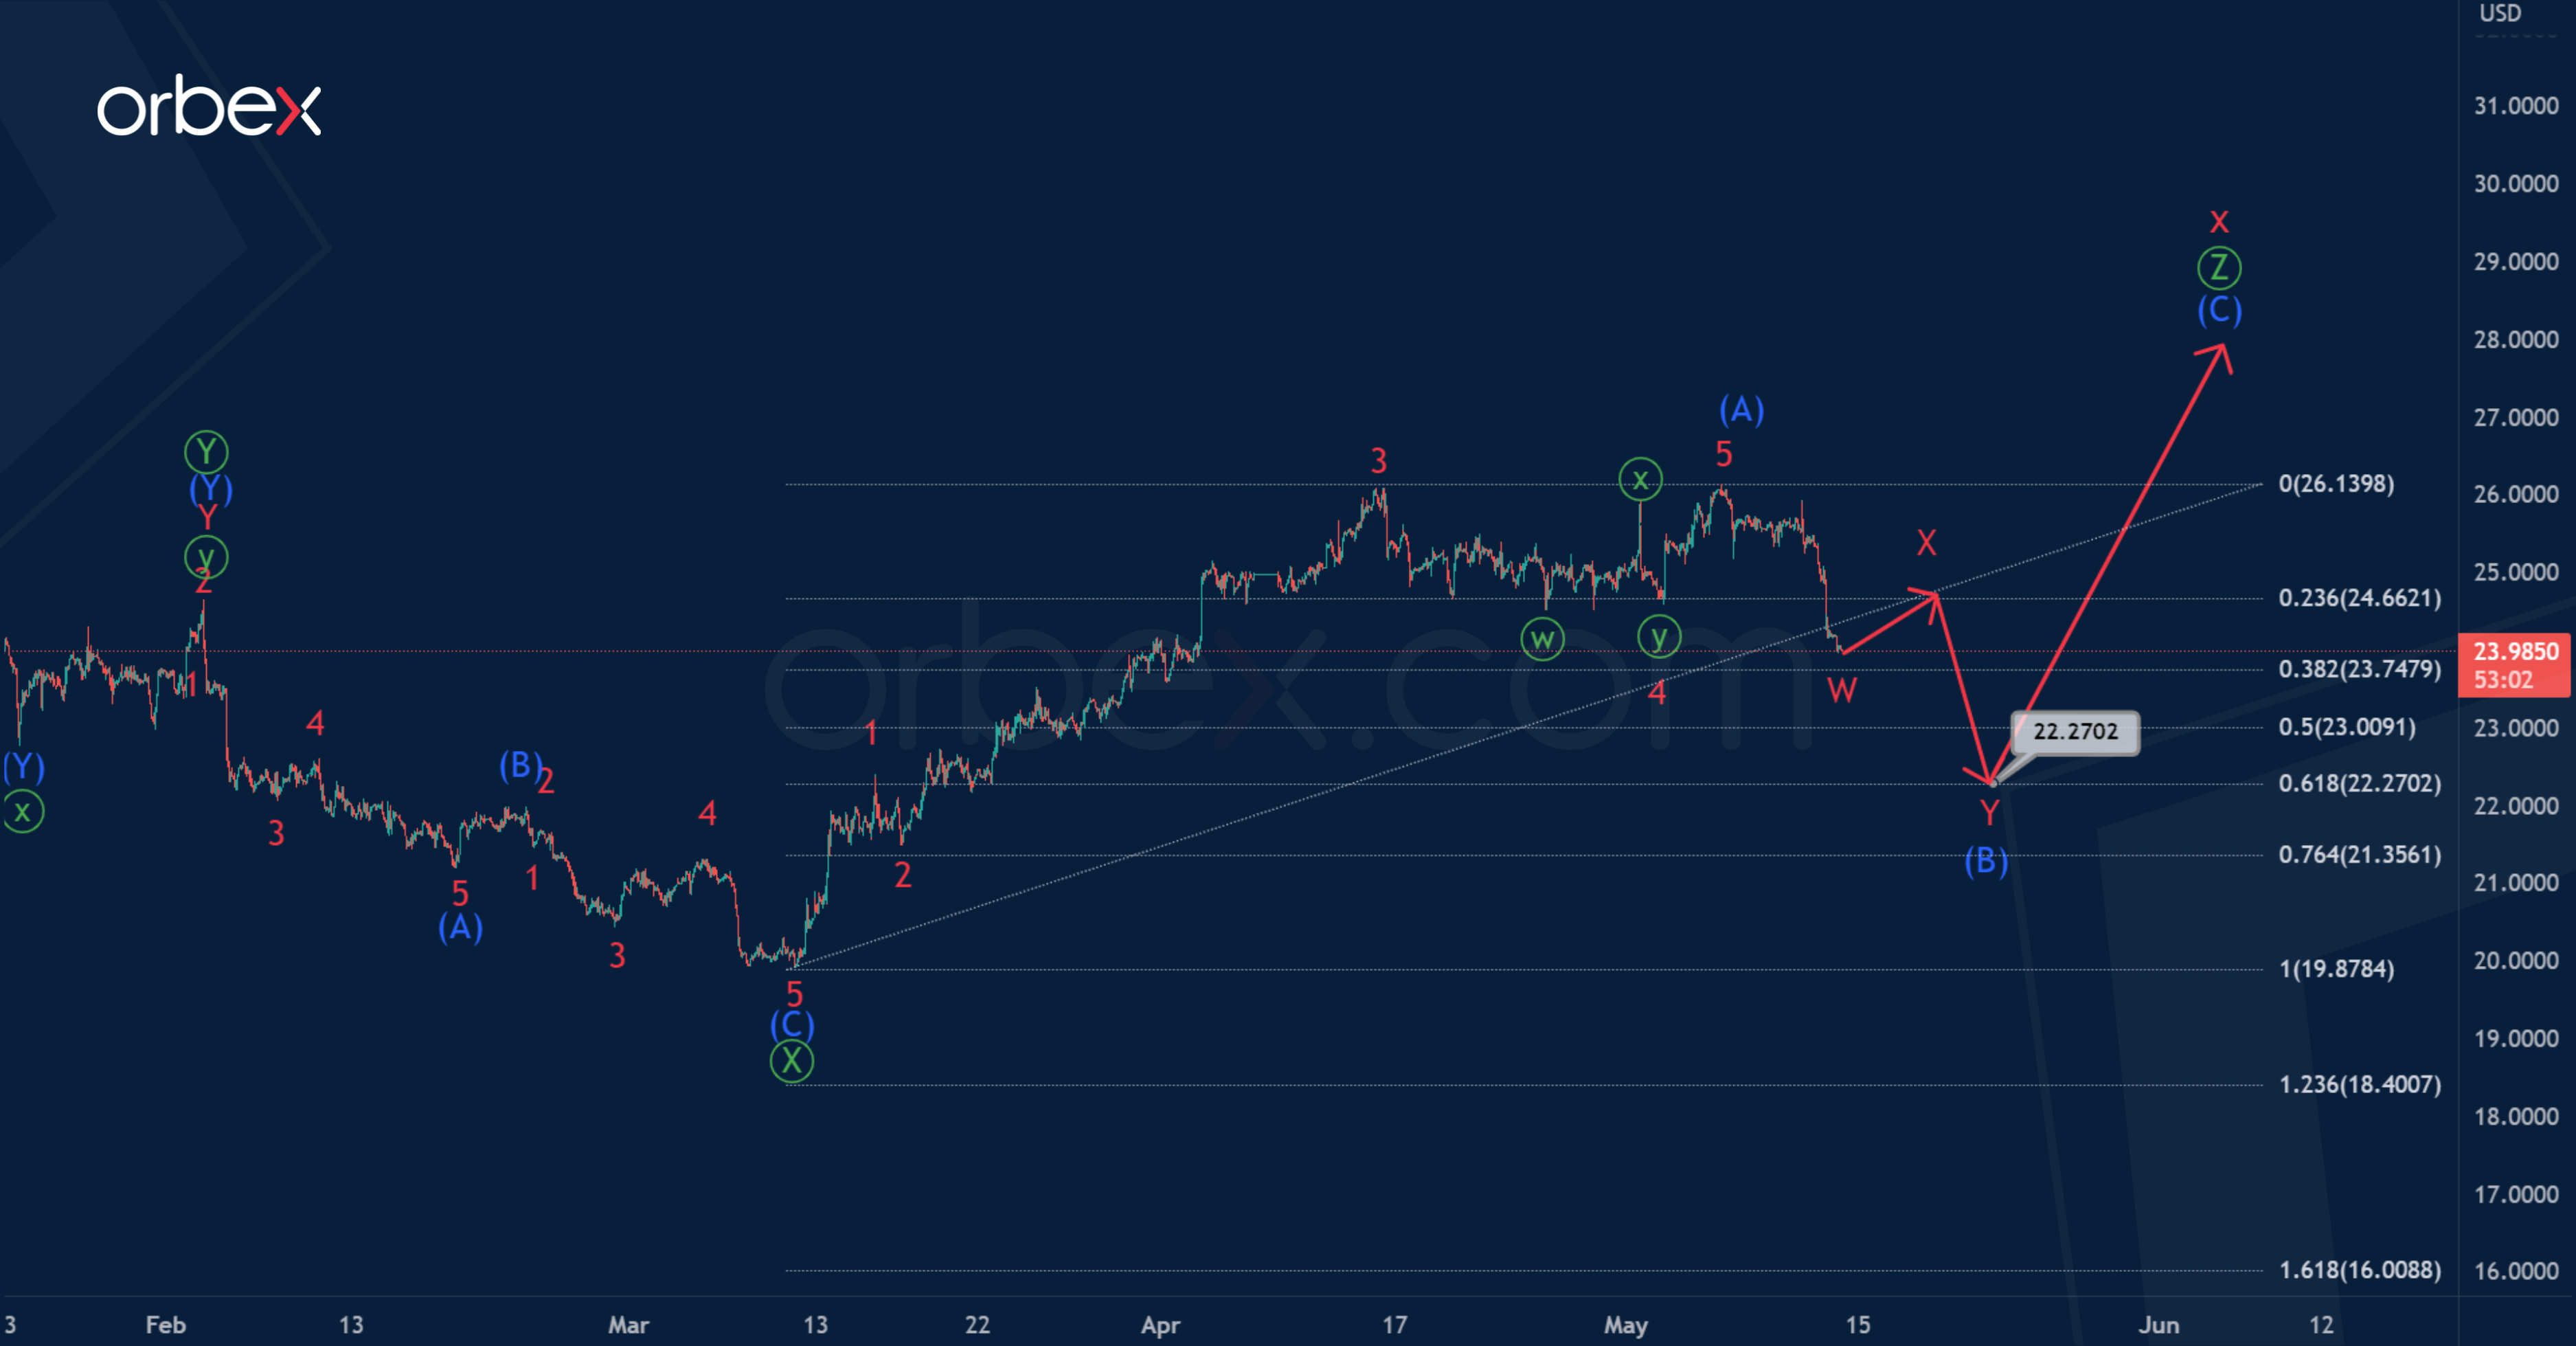
In the second scenario, the market focuses on the development of an intermediate wave (B). As in the main version, it can be a double zigzag. However, only the minor wave W is completed.
In the near future, a slight rise is possible in the second part, namely in wave X, after which a decrease is expected in the final actionary wave Y.
It is assumed that the intermediate correction (B) will be at 61.8% of impulse (A), and will end near 22.270.

