
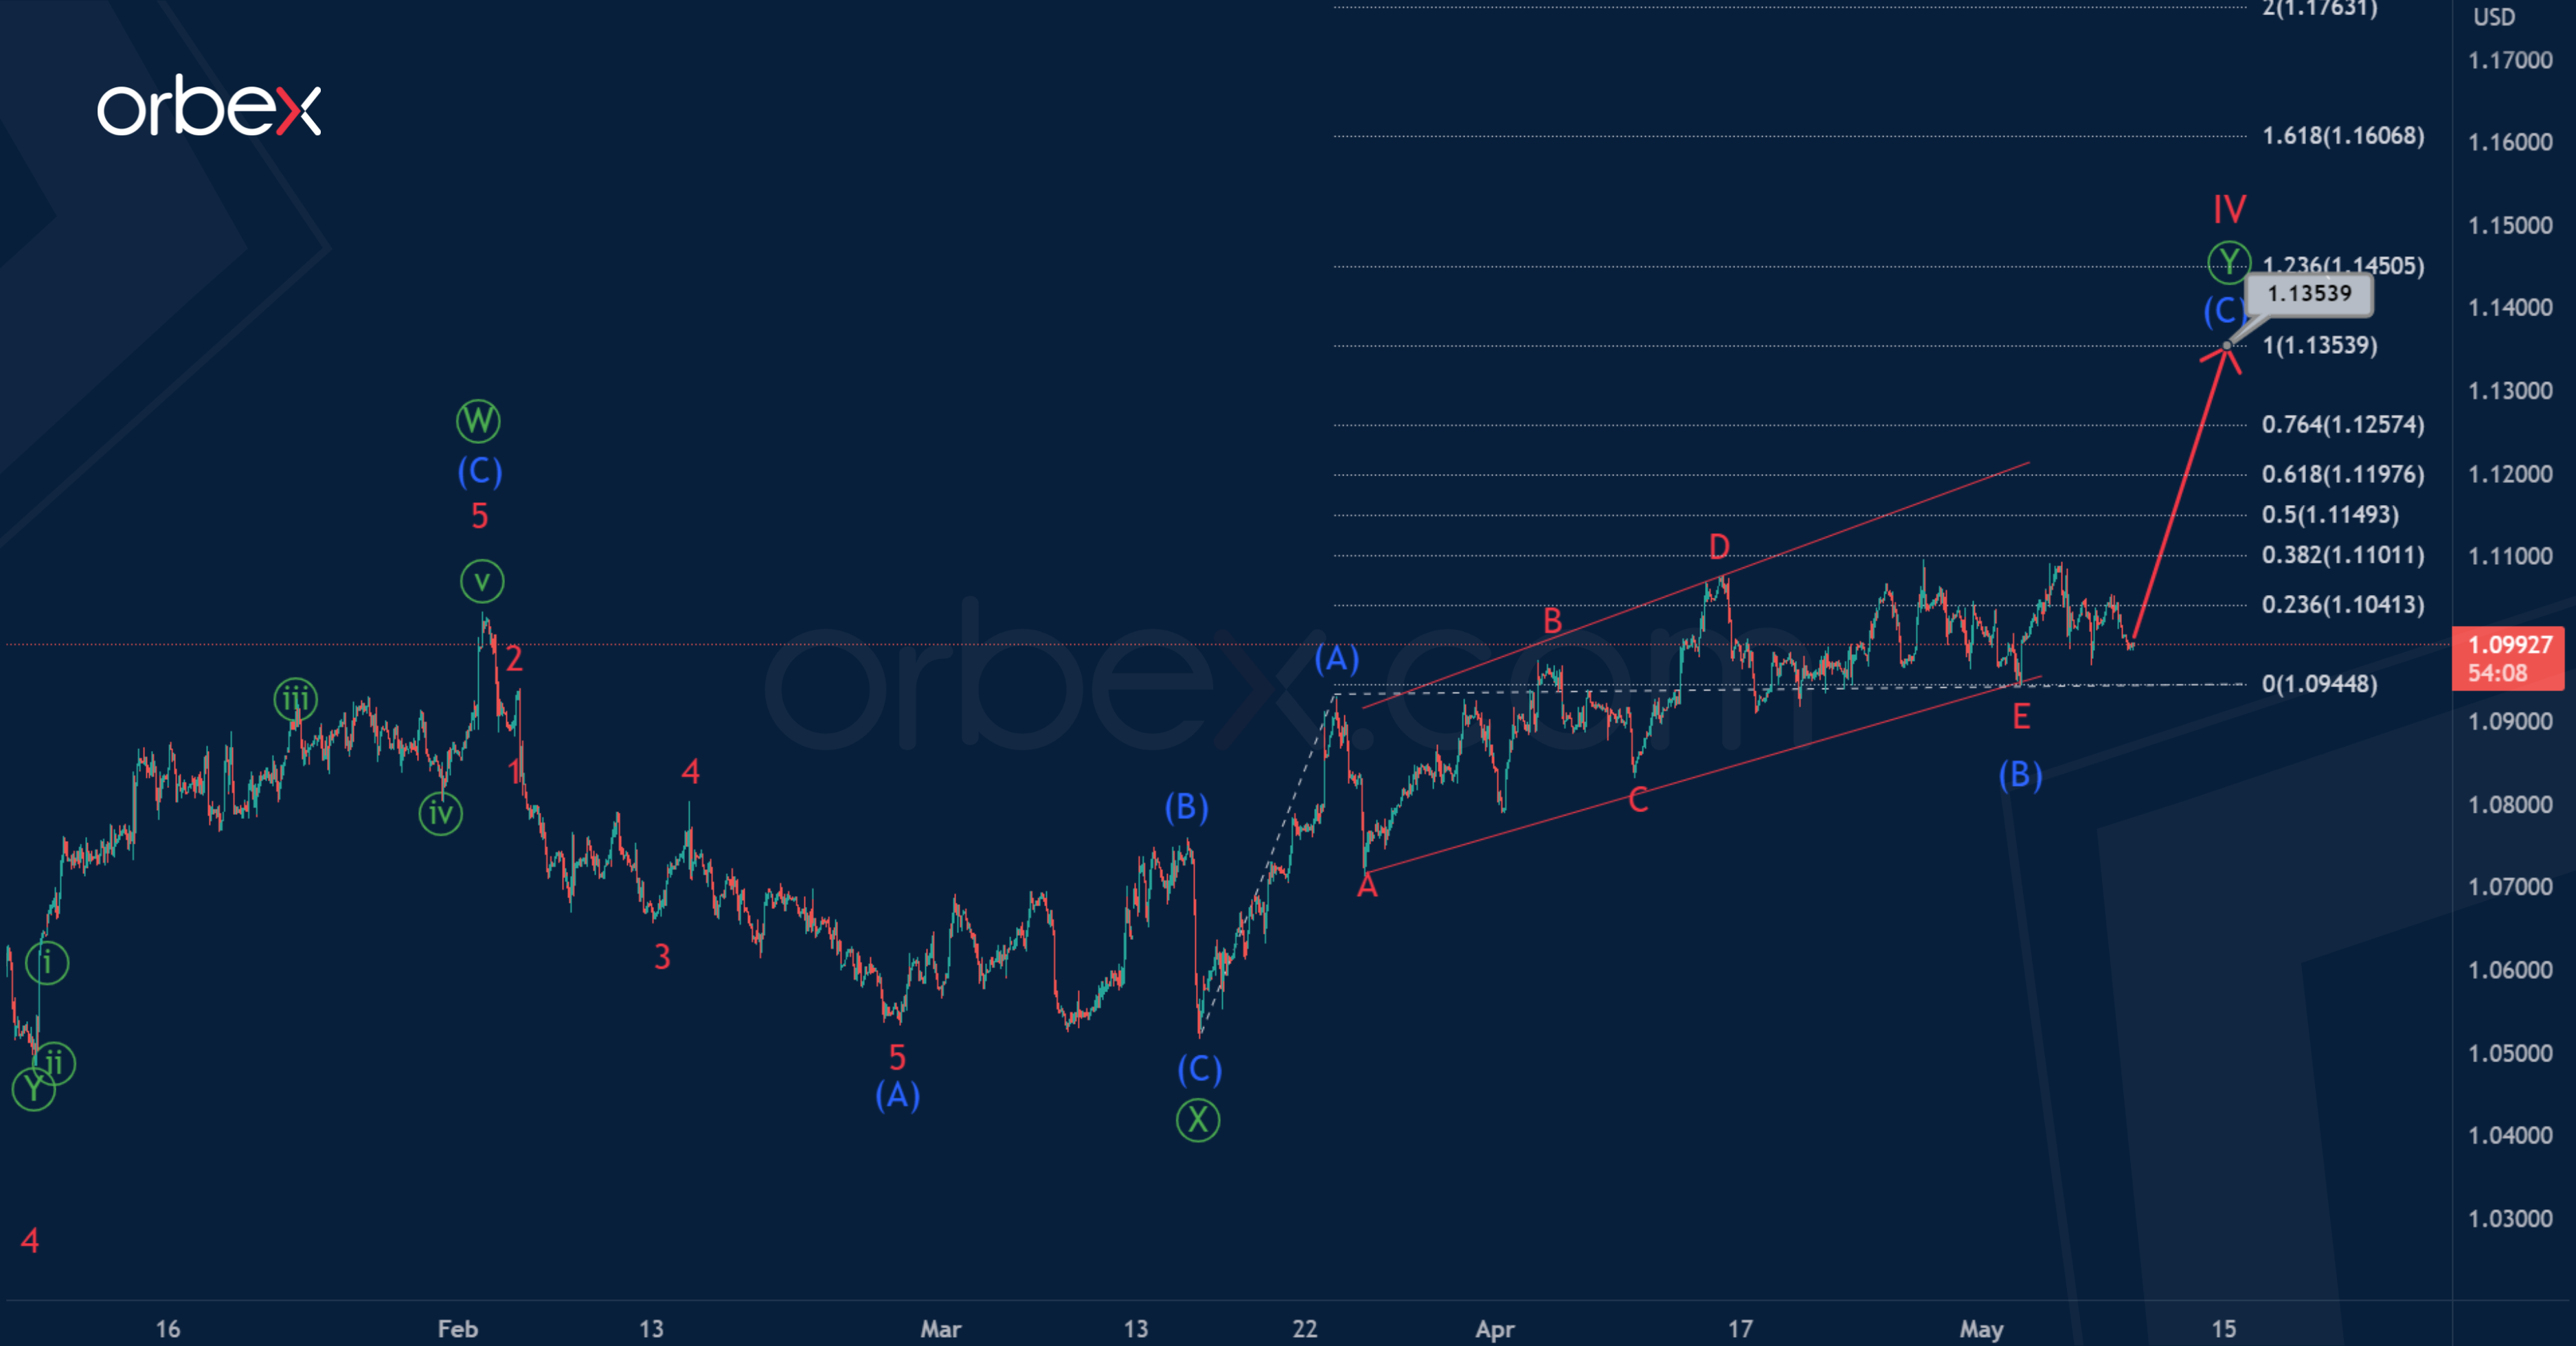
For the EURUSD pair, we can observe the formation of a correction wave IV inside a large impulse. Cycle correction IV, most likely takes the form of a primary double zigzag Ⓦ-Ⓧ-Ⓨ.
The actionary leg Ⓦ and the bearish corrective intervening wave Ⓧ are completed. The final actionary wave Ⓨ could be under development.
Like the previous primary waves, Ⓨ can take the form of an intermediate zigzag (A)-(B)-(C). The first impulse (A) and correction (B) in the form of a skewed triangle have ended. In the near future, we expect growth in the potential impulse (C) to 1.135. At that level, this impulse will be equal to wave (A).

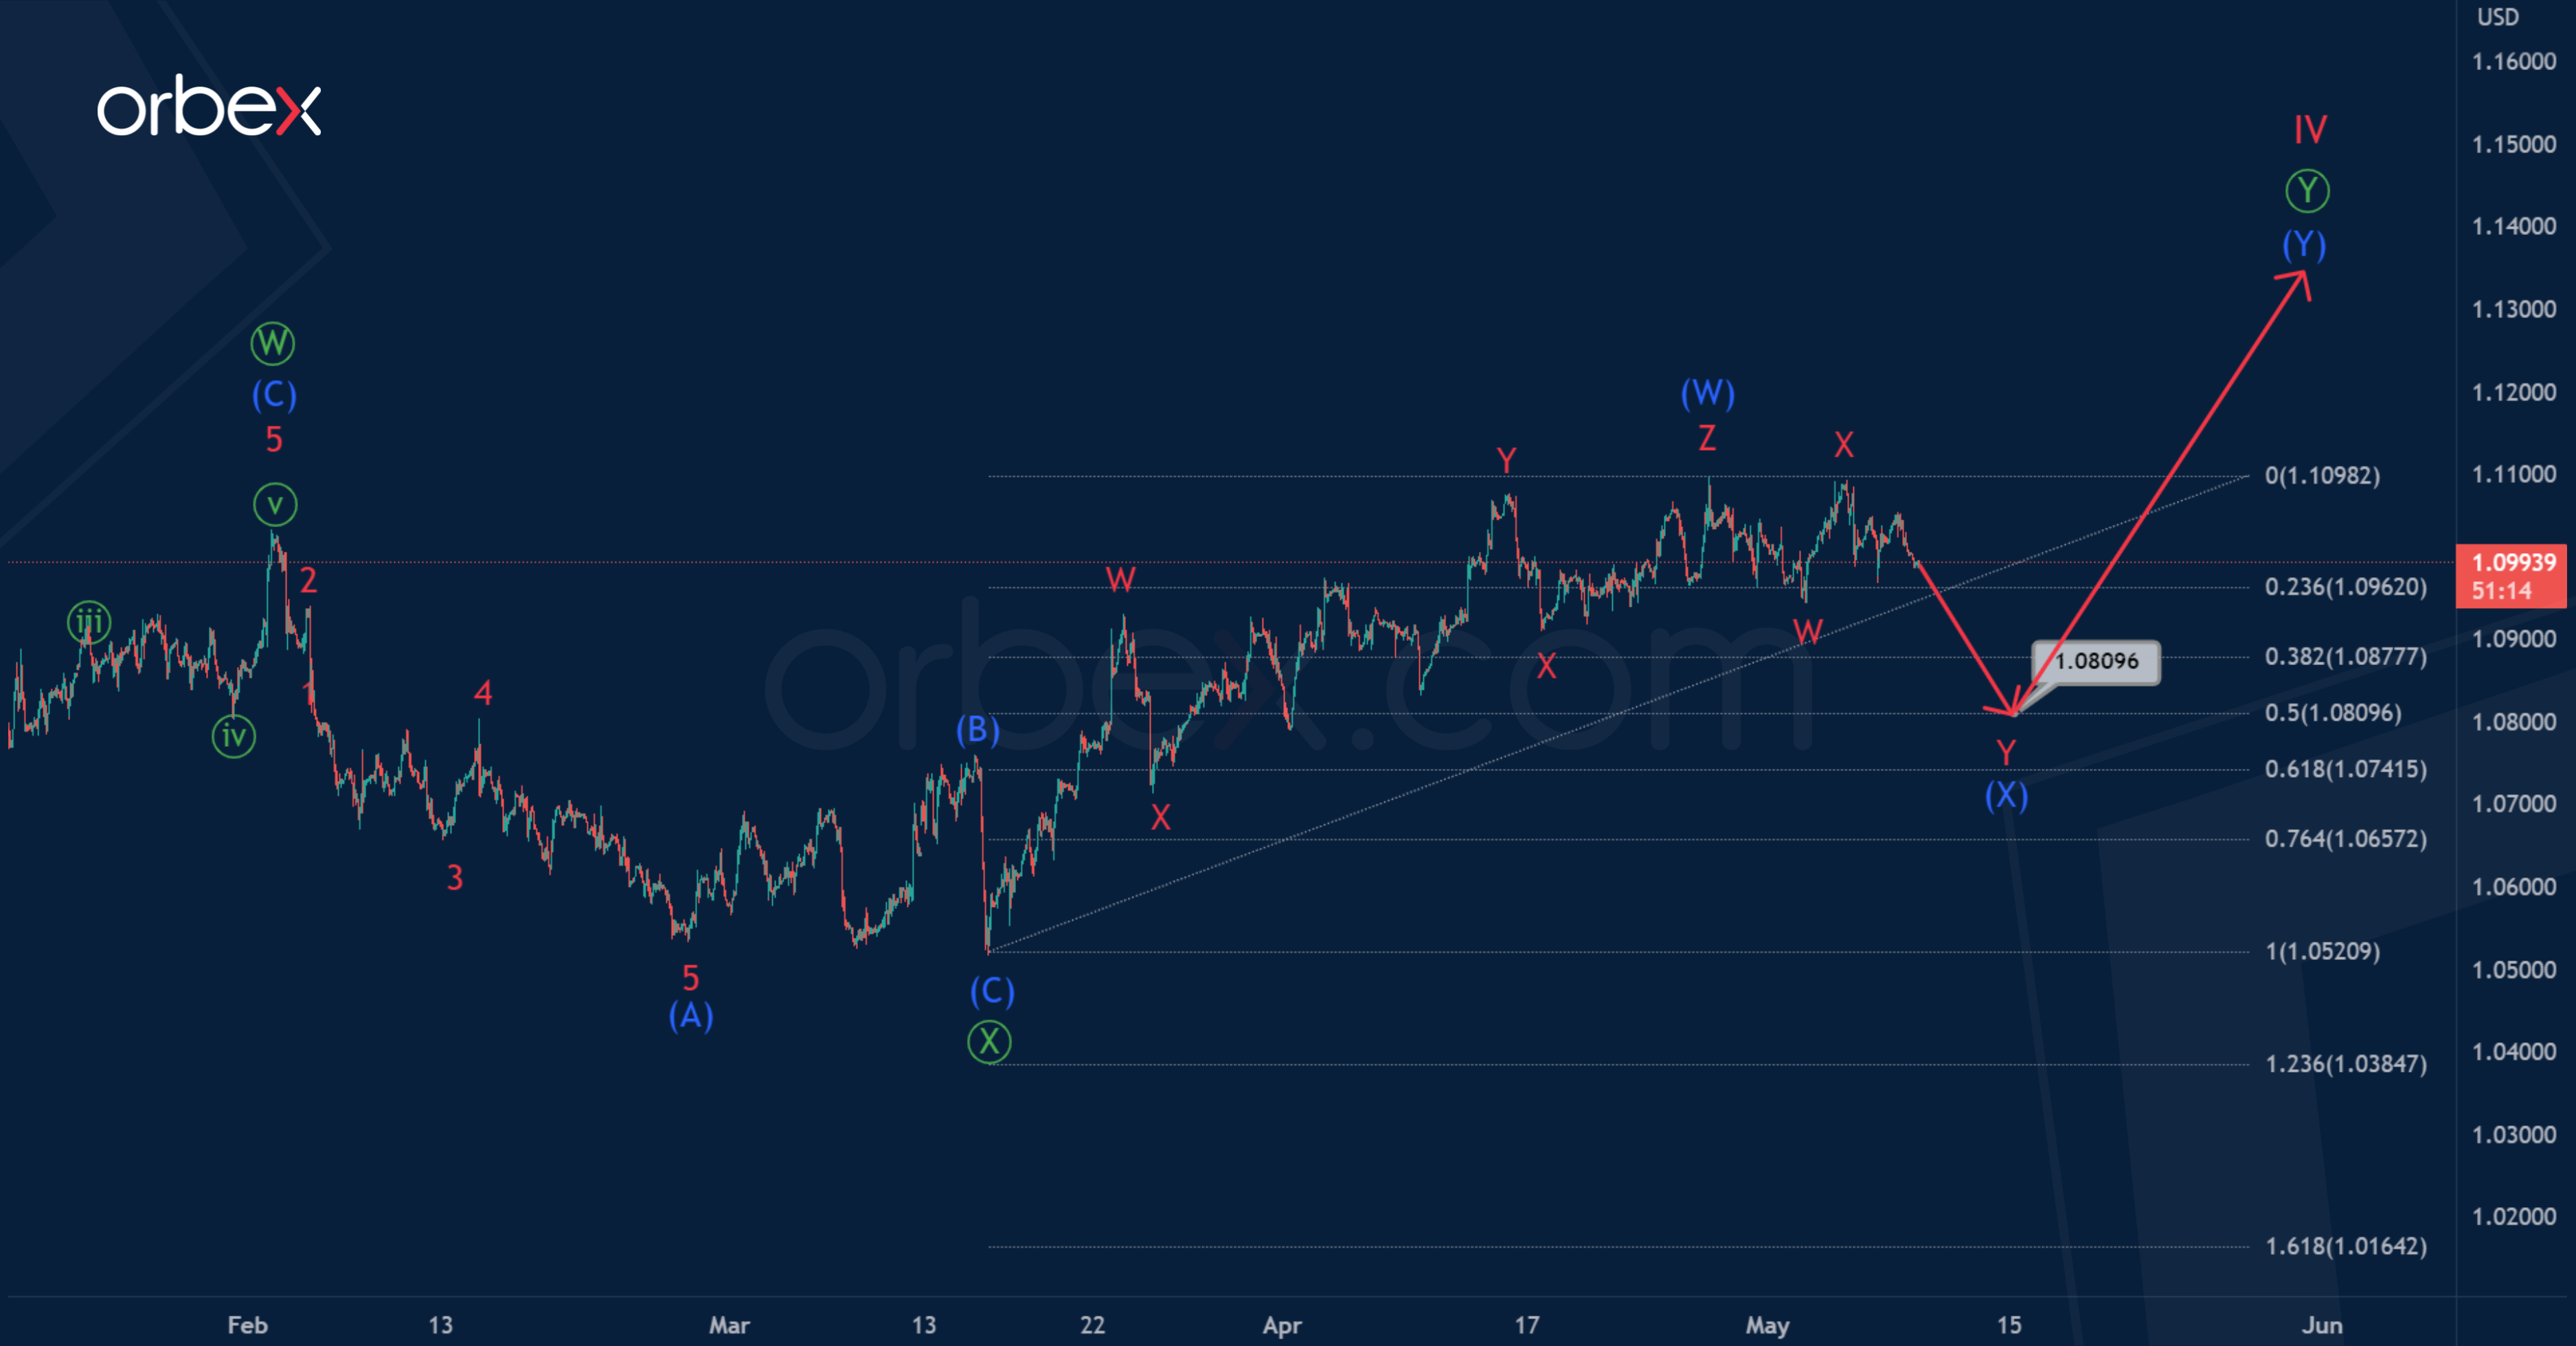
An alternative scenario suggests that the primary wave Ⓨ is not a simple zigzag, but a double one. It is marked with sub-waves (W)-(X)-(Y).
The intermediate wave (W) looks like a completed triple zigzag. Currently, an intermediate wave (X) could be in the process of construction, which could take the form of a minor double zigzag W-X-Y.
In the near future, the price could go down to 1.080. At that level, wave (X) will be at 50% along the Fibonacci lines of wave (W).

