
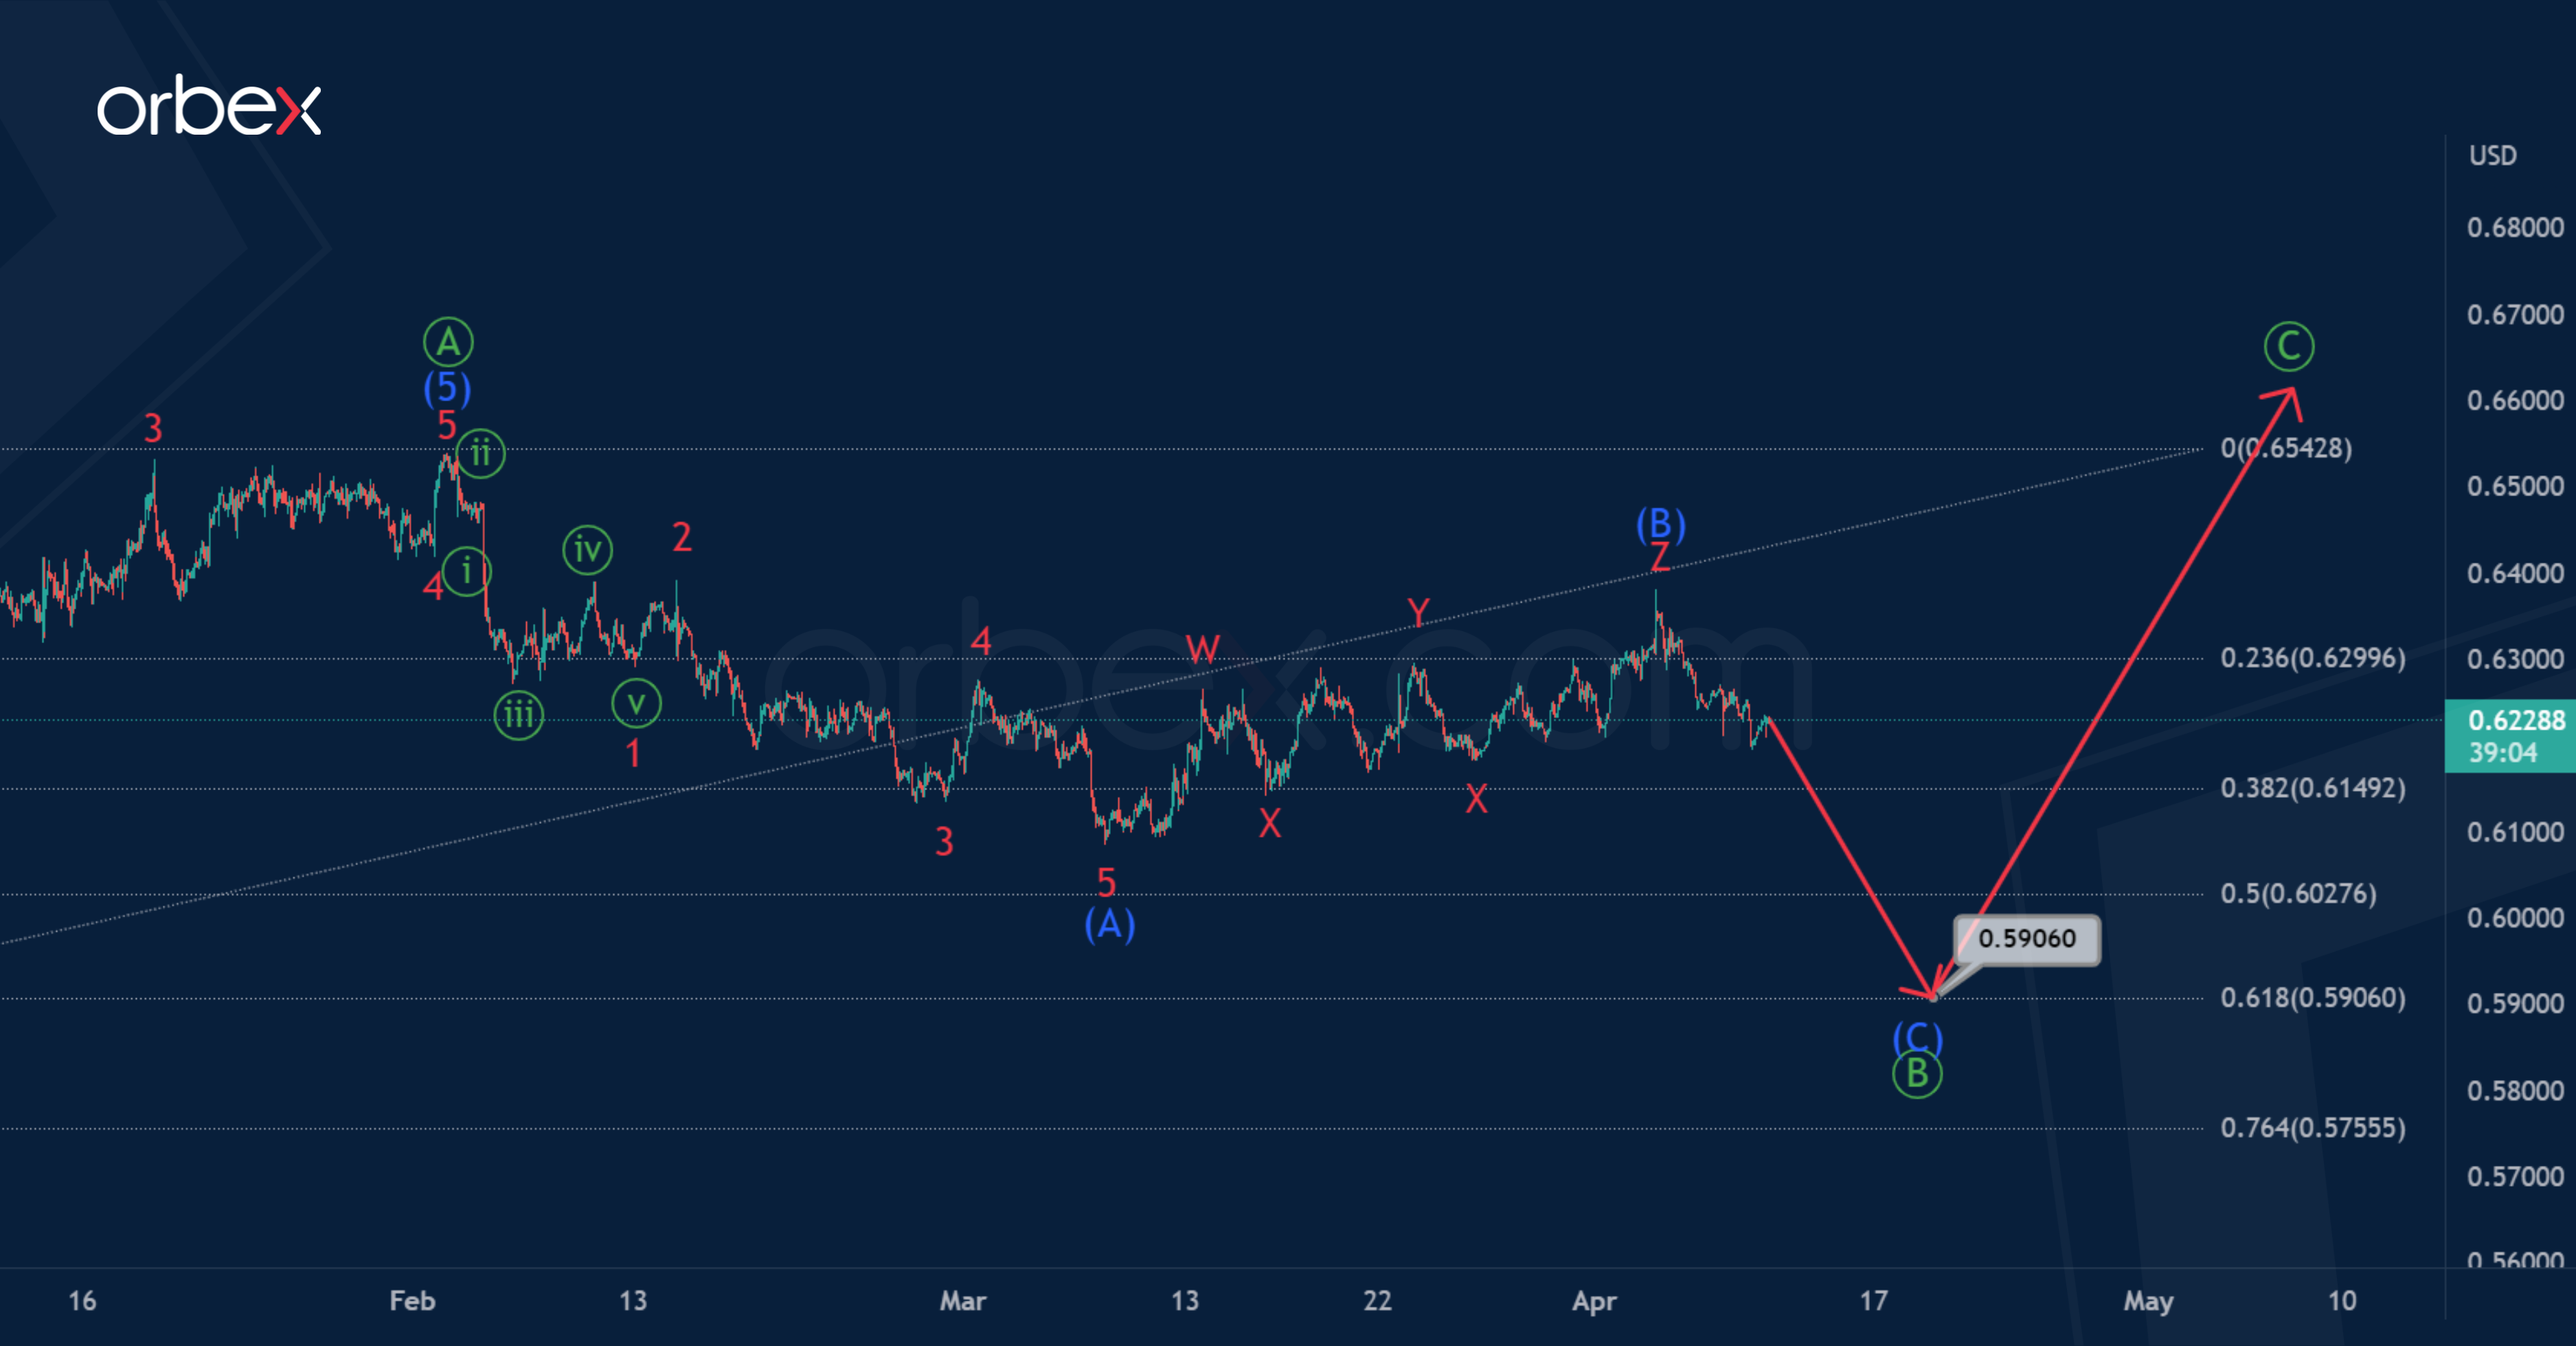
The current chart shows that NZDUSD in the long term could form a corrective zigzag pattern consisting of primary waves Ⓐ-Ⓑ-Ⓒ.
The first impulse wave Ⓐ has ended. A bearish correction wave Ⓑ is under development which is similar to a zigzag (A)-(B)-(C). Impulse (A) and correction (B) can be considered completed.
In the near future, the price could drop in the intermediate impulse (C) to 0.590. At that level, primary correction will be at 61.8% of actionary wave Ⓐ.

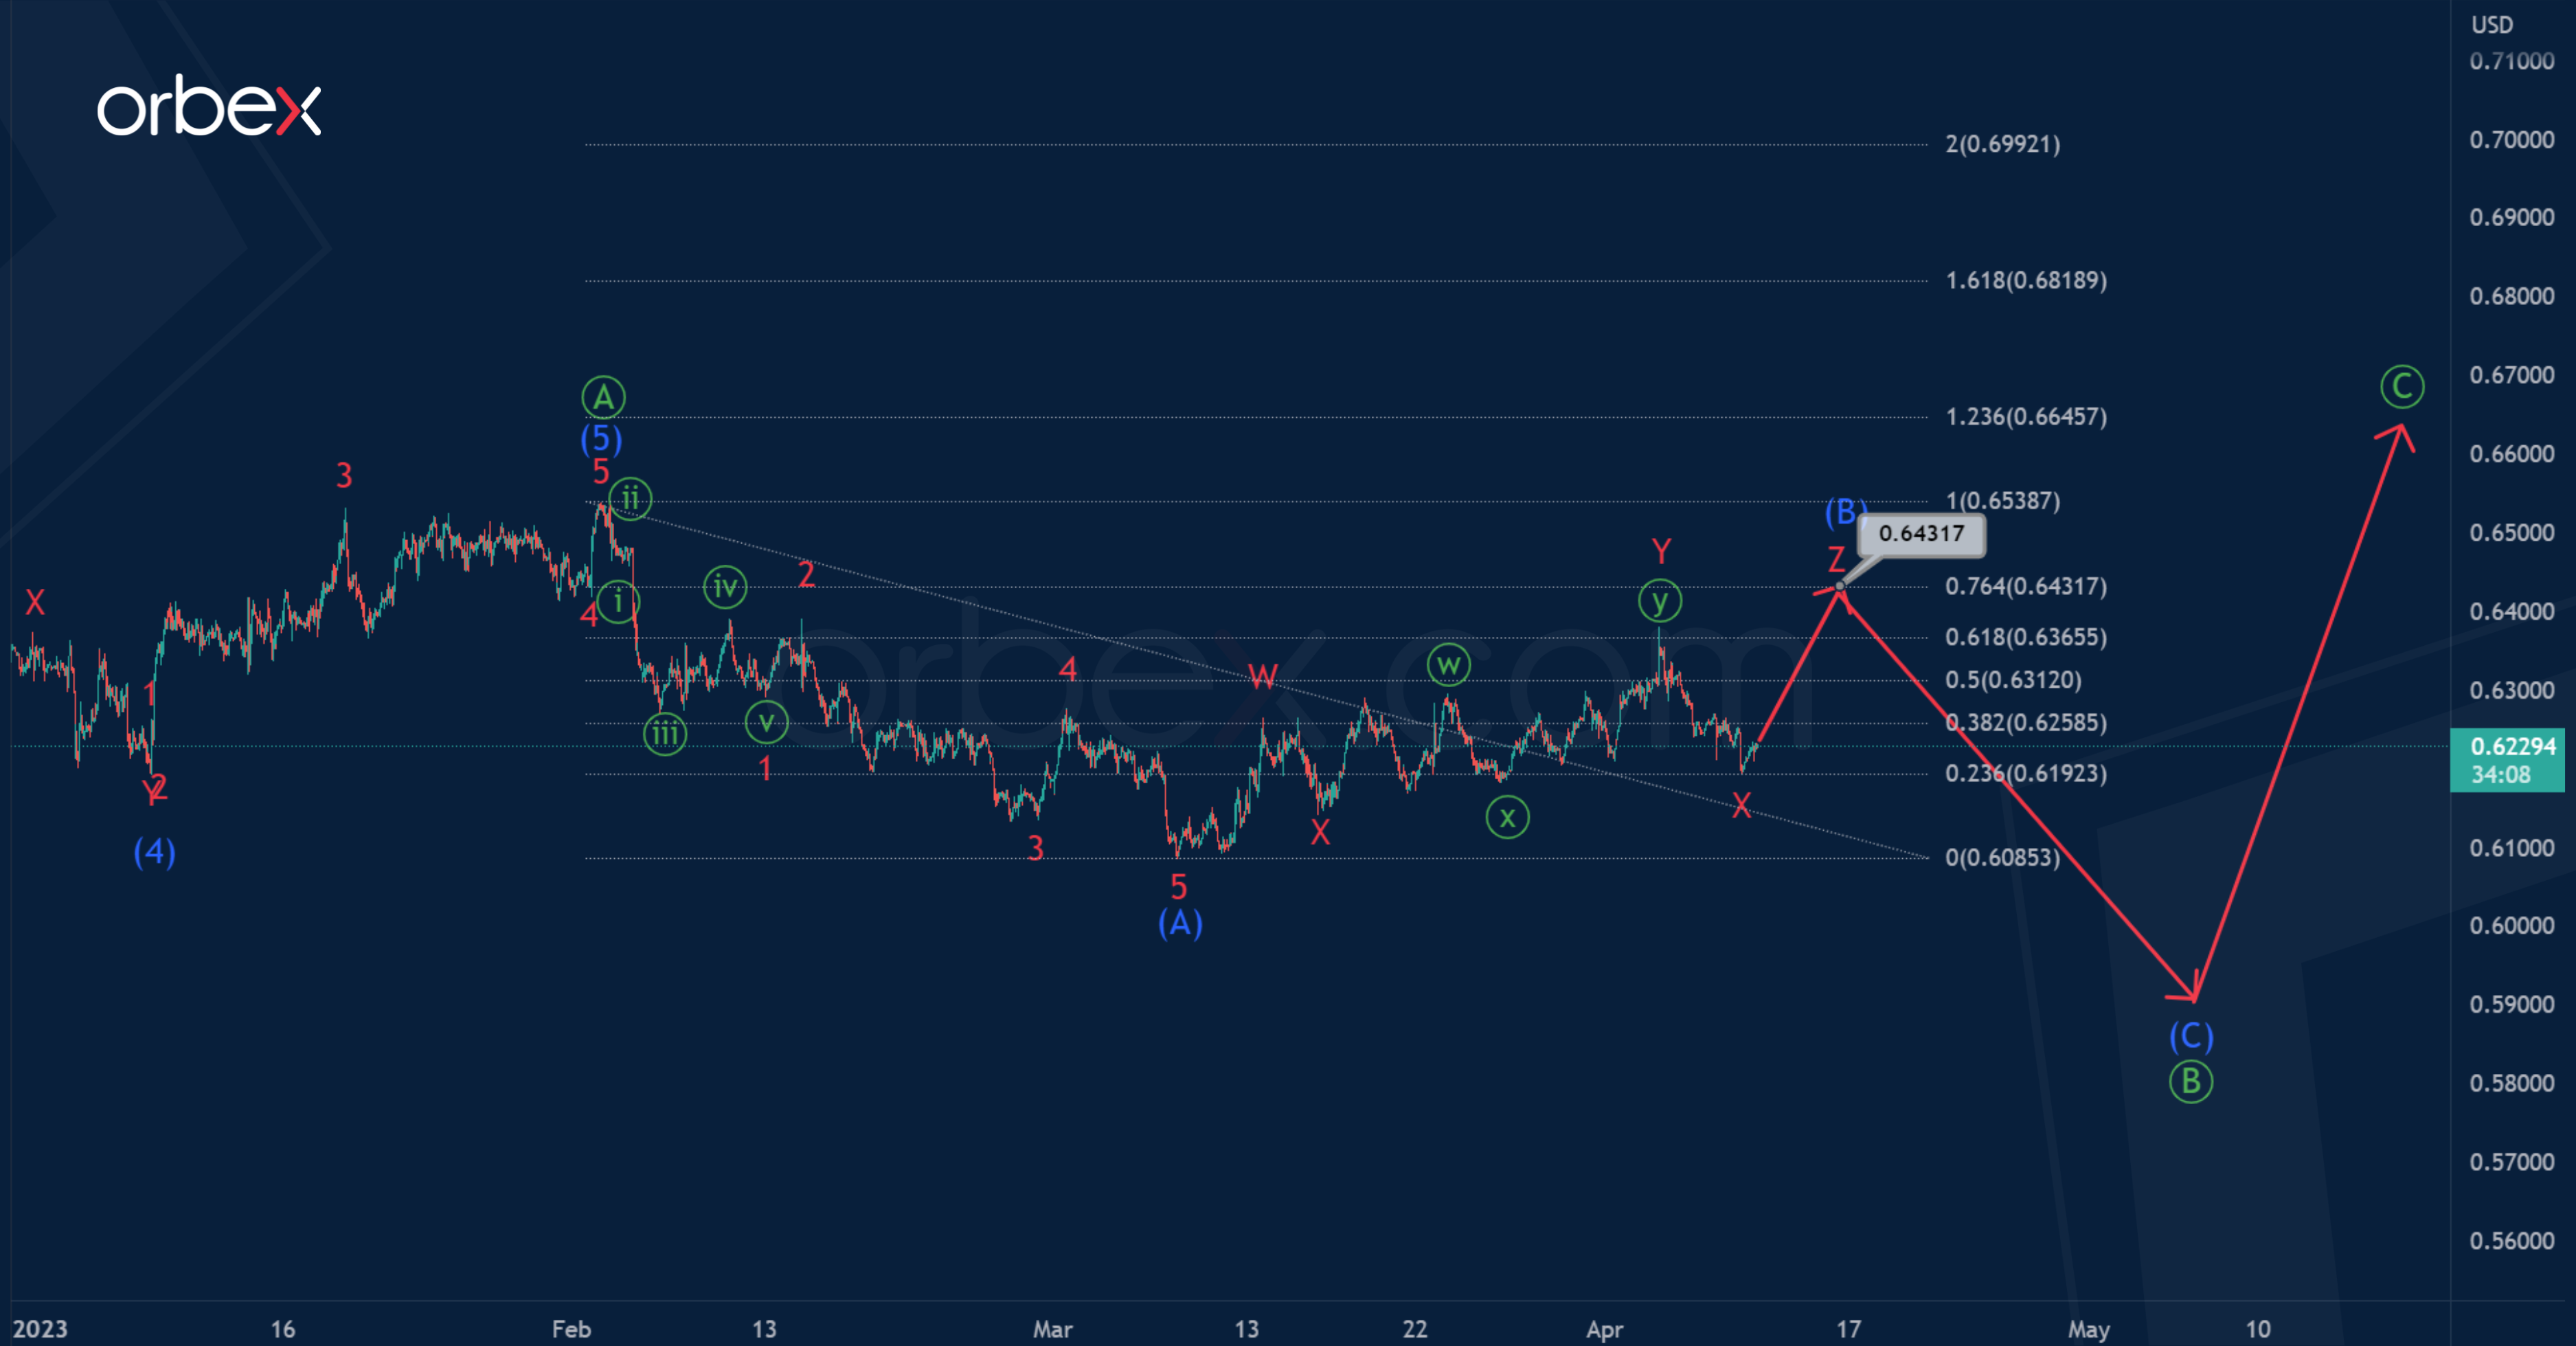
Alternatively, only the first impulse wave (A) is completed inside the primary correction Ⓑ. The intermediate correction (B) is likely to continue to form.
It is assumed that the correction (B) takes the form of a minor triple zigzag, in which the first four parts have ended. In the near future, prices could rise in the final actionary wave Z.
Most likely, the price will rise to 0.643. At that level, correction (B) will be at 76.4% along the Fibonacci lines of impulse (A).

![Credit Card 160×600 [EN]](https://assets.iorbex.com/blog/wp-content/uploads/2023/06/13144507/Blog-Banner_EN-Banner_160X600X2.webp)