BABA: The Bears Are Not Giving Up, We Are Waiting For The Continuation Of The Downward Trend!

In the long term, a bearish trend is forming for BABA shares.
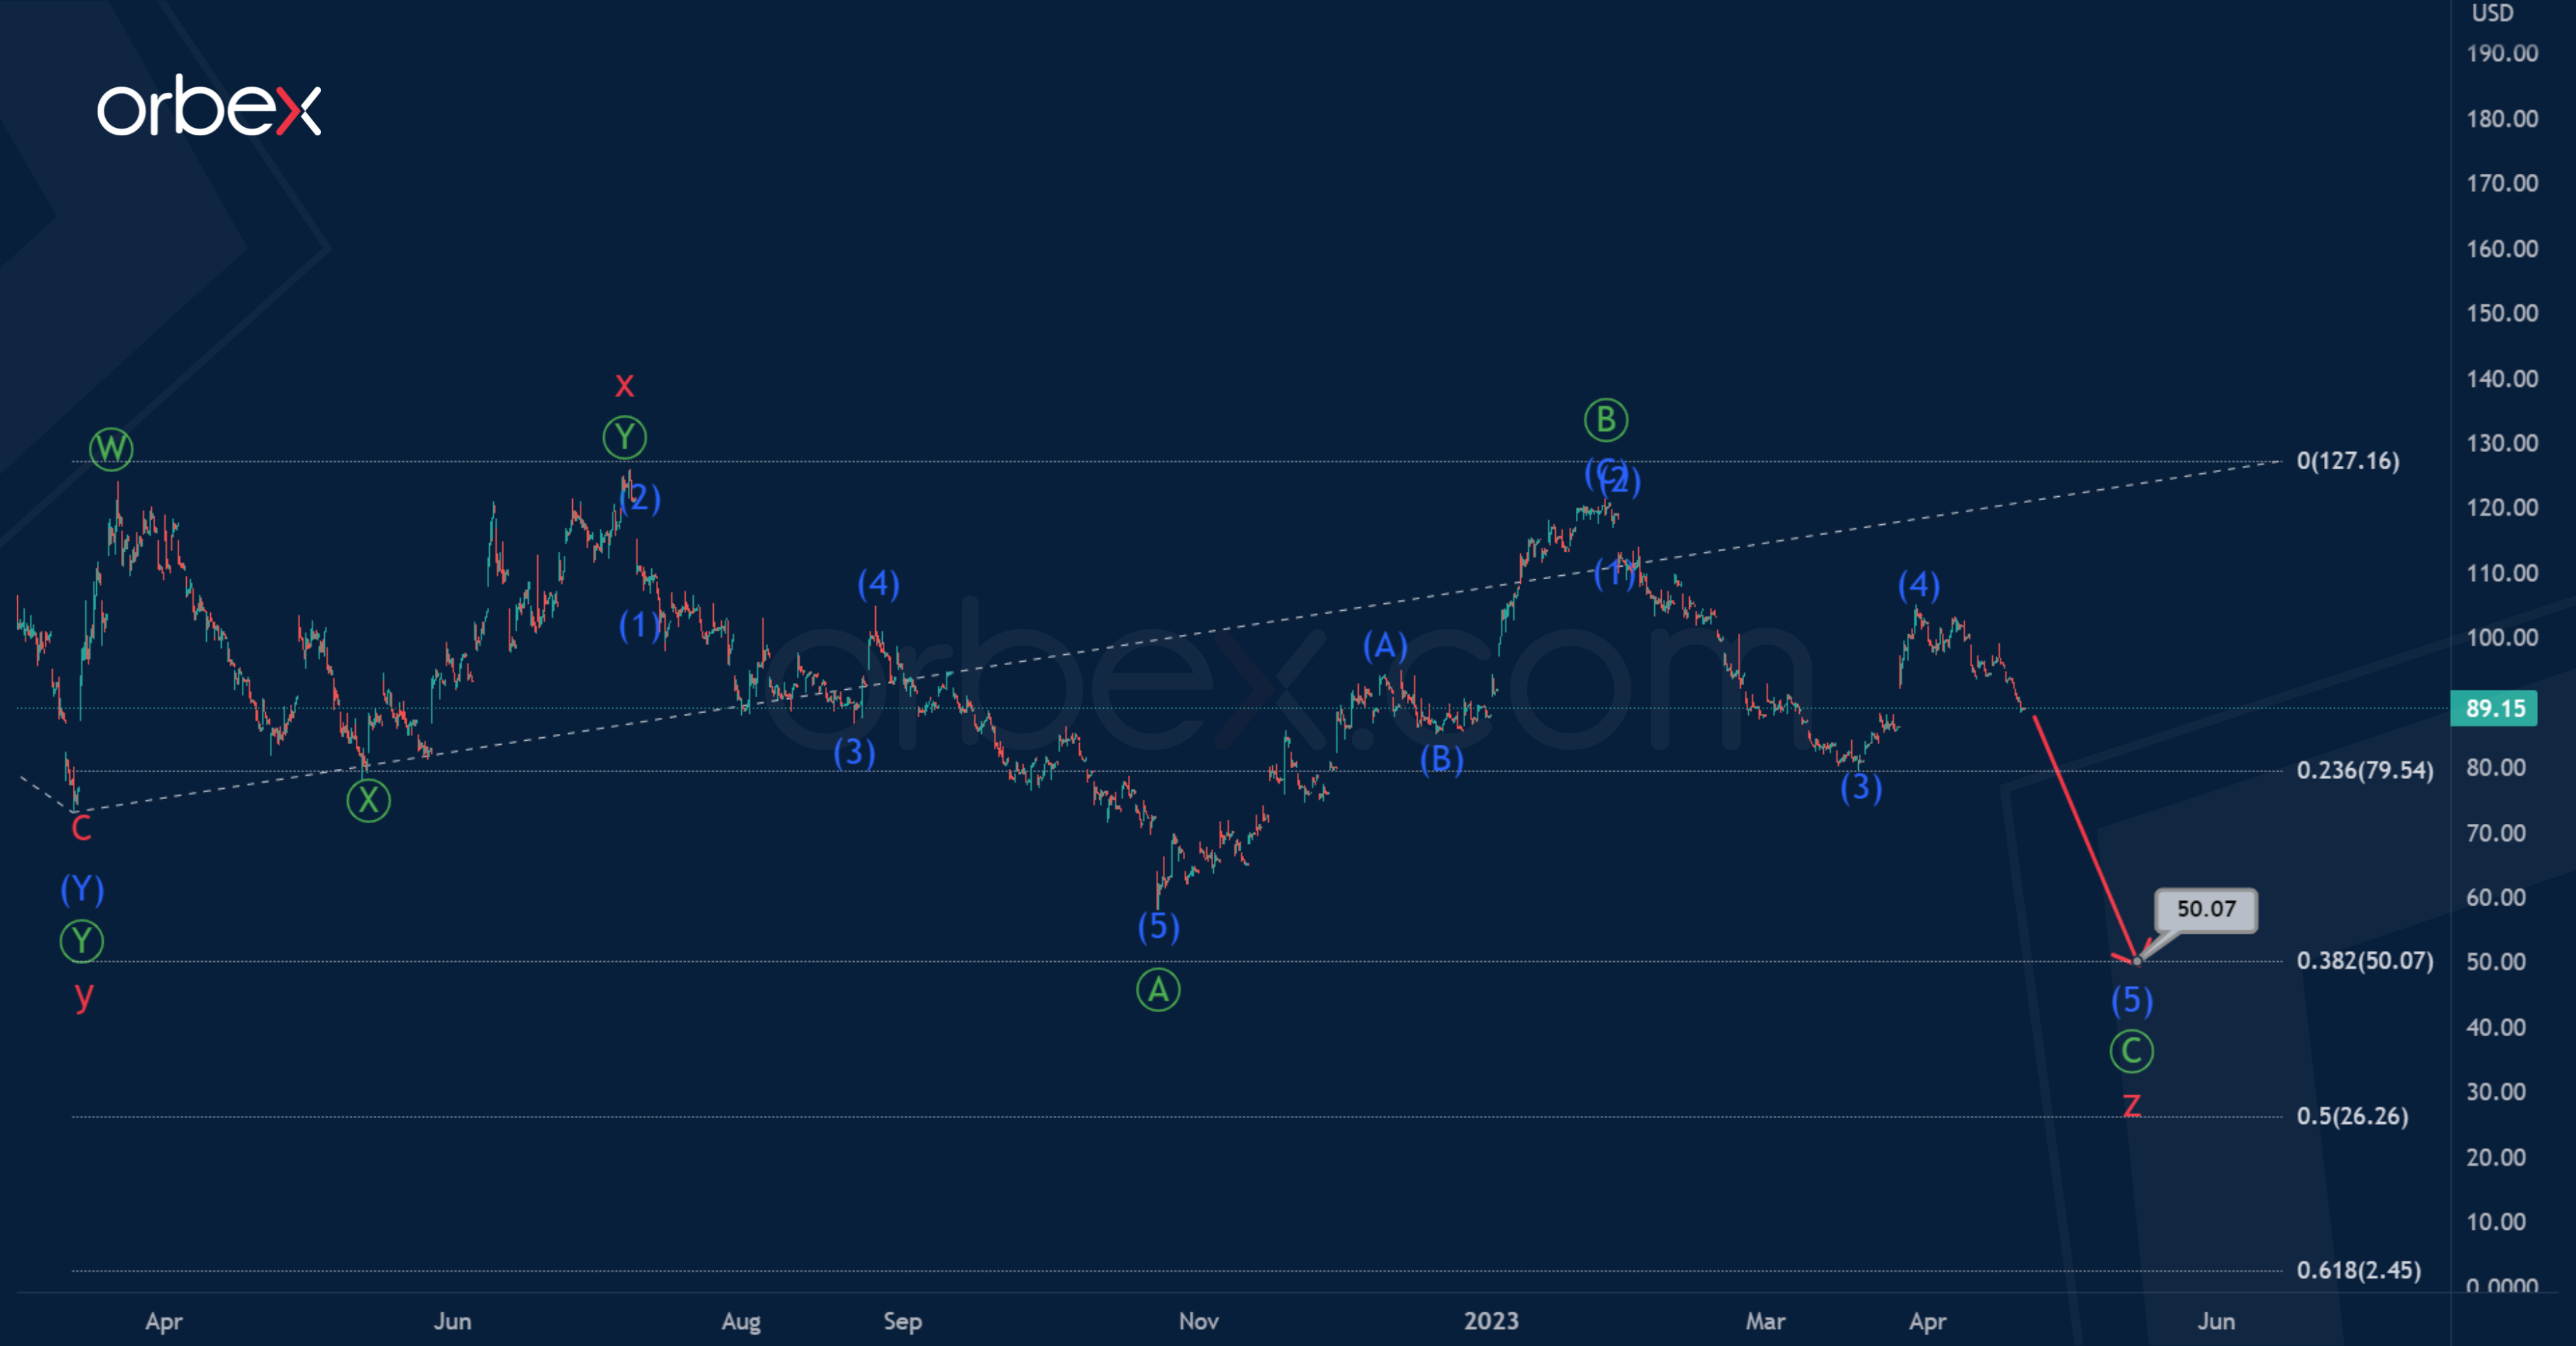
We see the final part of the completed actionary wave y and the second small intervening wave x, both of these waves are double zigzags.
At the time of writing the review, the formation of the final actionary wave z is taking place, which, most likely, will take the form of a primary zigzag Ⓐ-Ⓑ-Ⓒ.

There is a high probability that the primary impulse Ⓐ and the correction Ⓑ have already been fully completed, so we can expect a decline to 50.07 in the sub-wave Ⓒ consisting of sub-waves (1)-(2)-(3)-(4)-(5). At the specified mark, wave z will be at 38.2% of wave y.
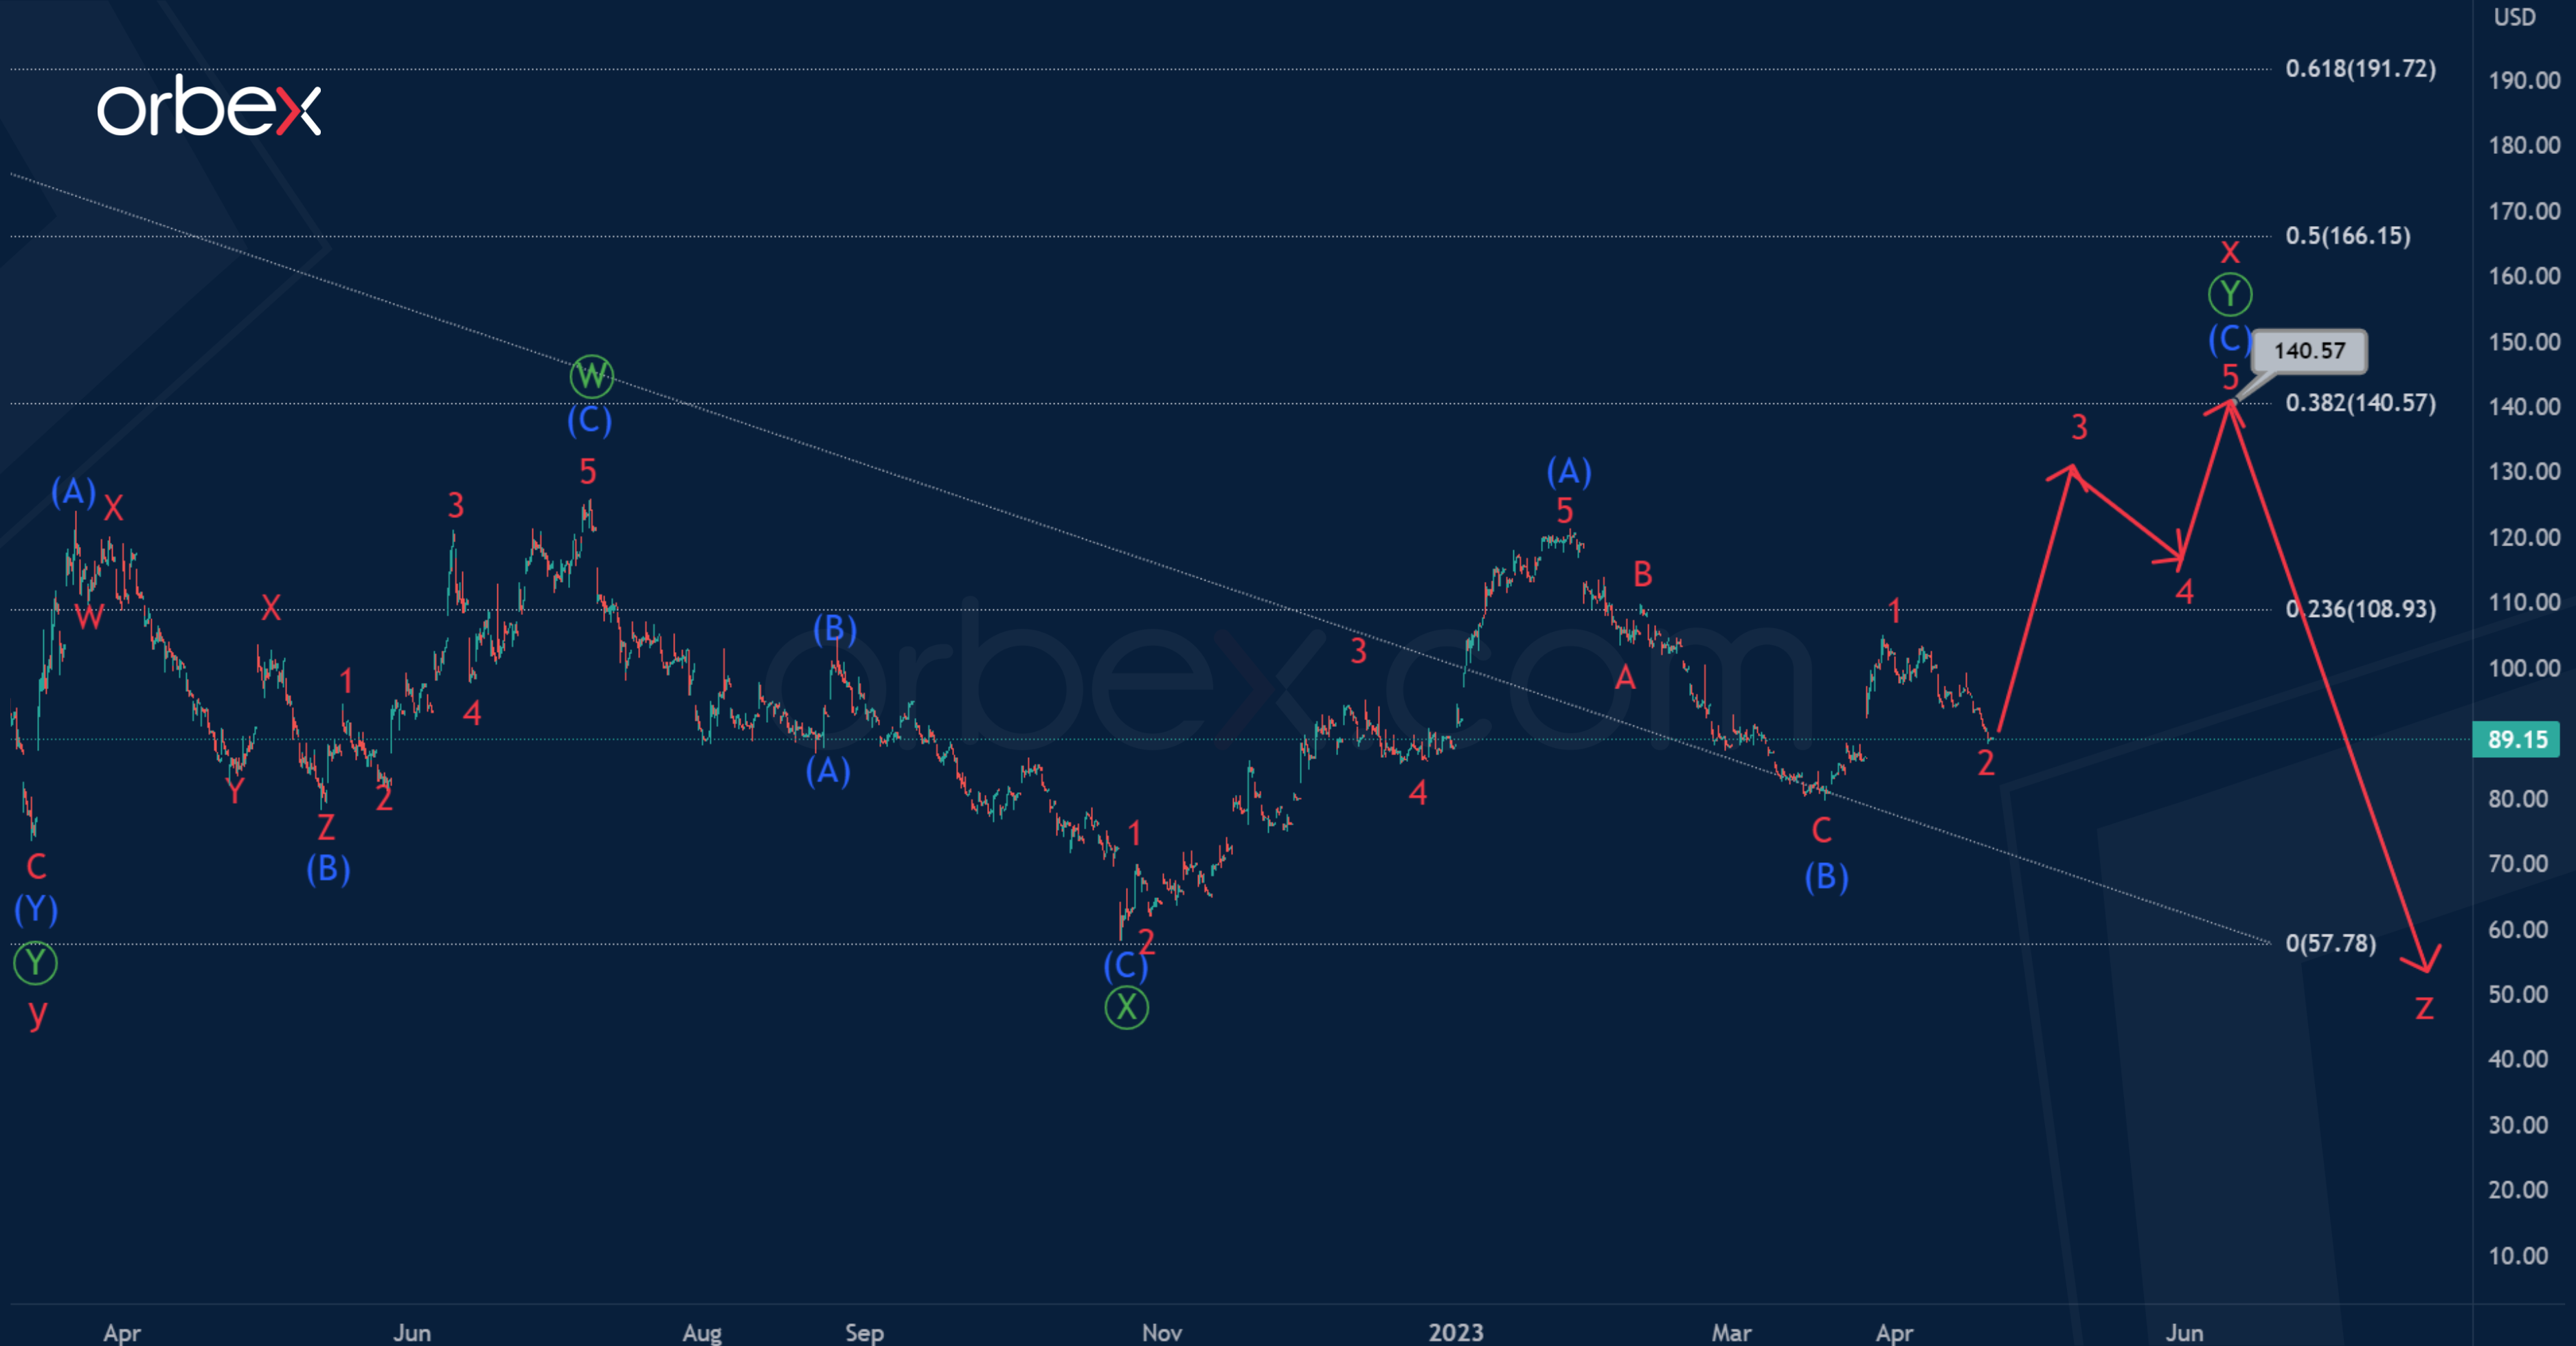
Let’s consider an alternative scenario in which only the first two zigzag sub-waves Ⓦ-Ⓧ are completed within the intervening wave x.
At the moment, the market is in a wave Ⓨ, which may take a zigzag structure (A)-(B)-(C) of the intermediate degree, as shown in the chart. Impulse (A) and correction (B) look formed.
Bulls in the intermediate wave (C), consisting of minor sub-waves 1-2-3-4-5, can lead the price to 140.57. At that level, cycle intervening wave x will be at 38.2% of actionary wave y.

![Credit Card 160×600 [EN]](https://assets.iorbex.com/blog/wp-content/uploads/2023/06/13144507/Blog-Banner_EN-Banner_160X600X2.webp)