
USDJPY pulls back
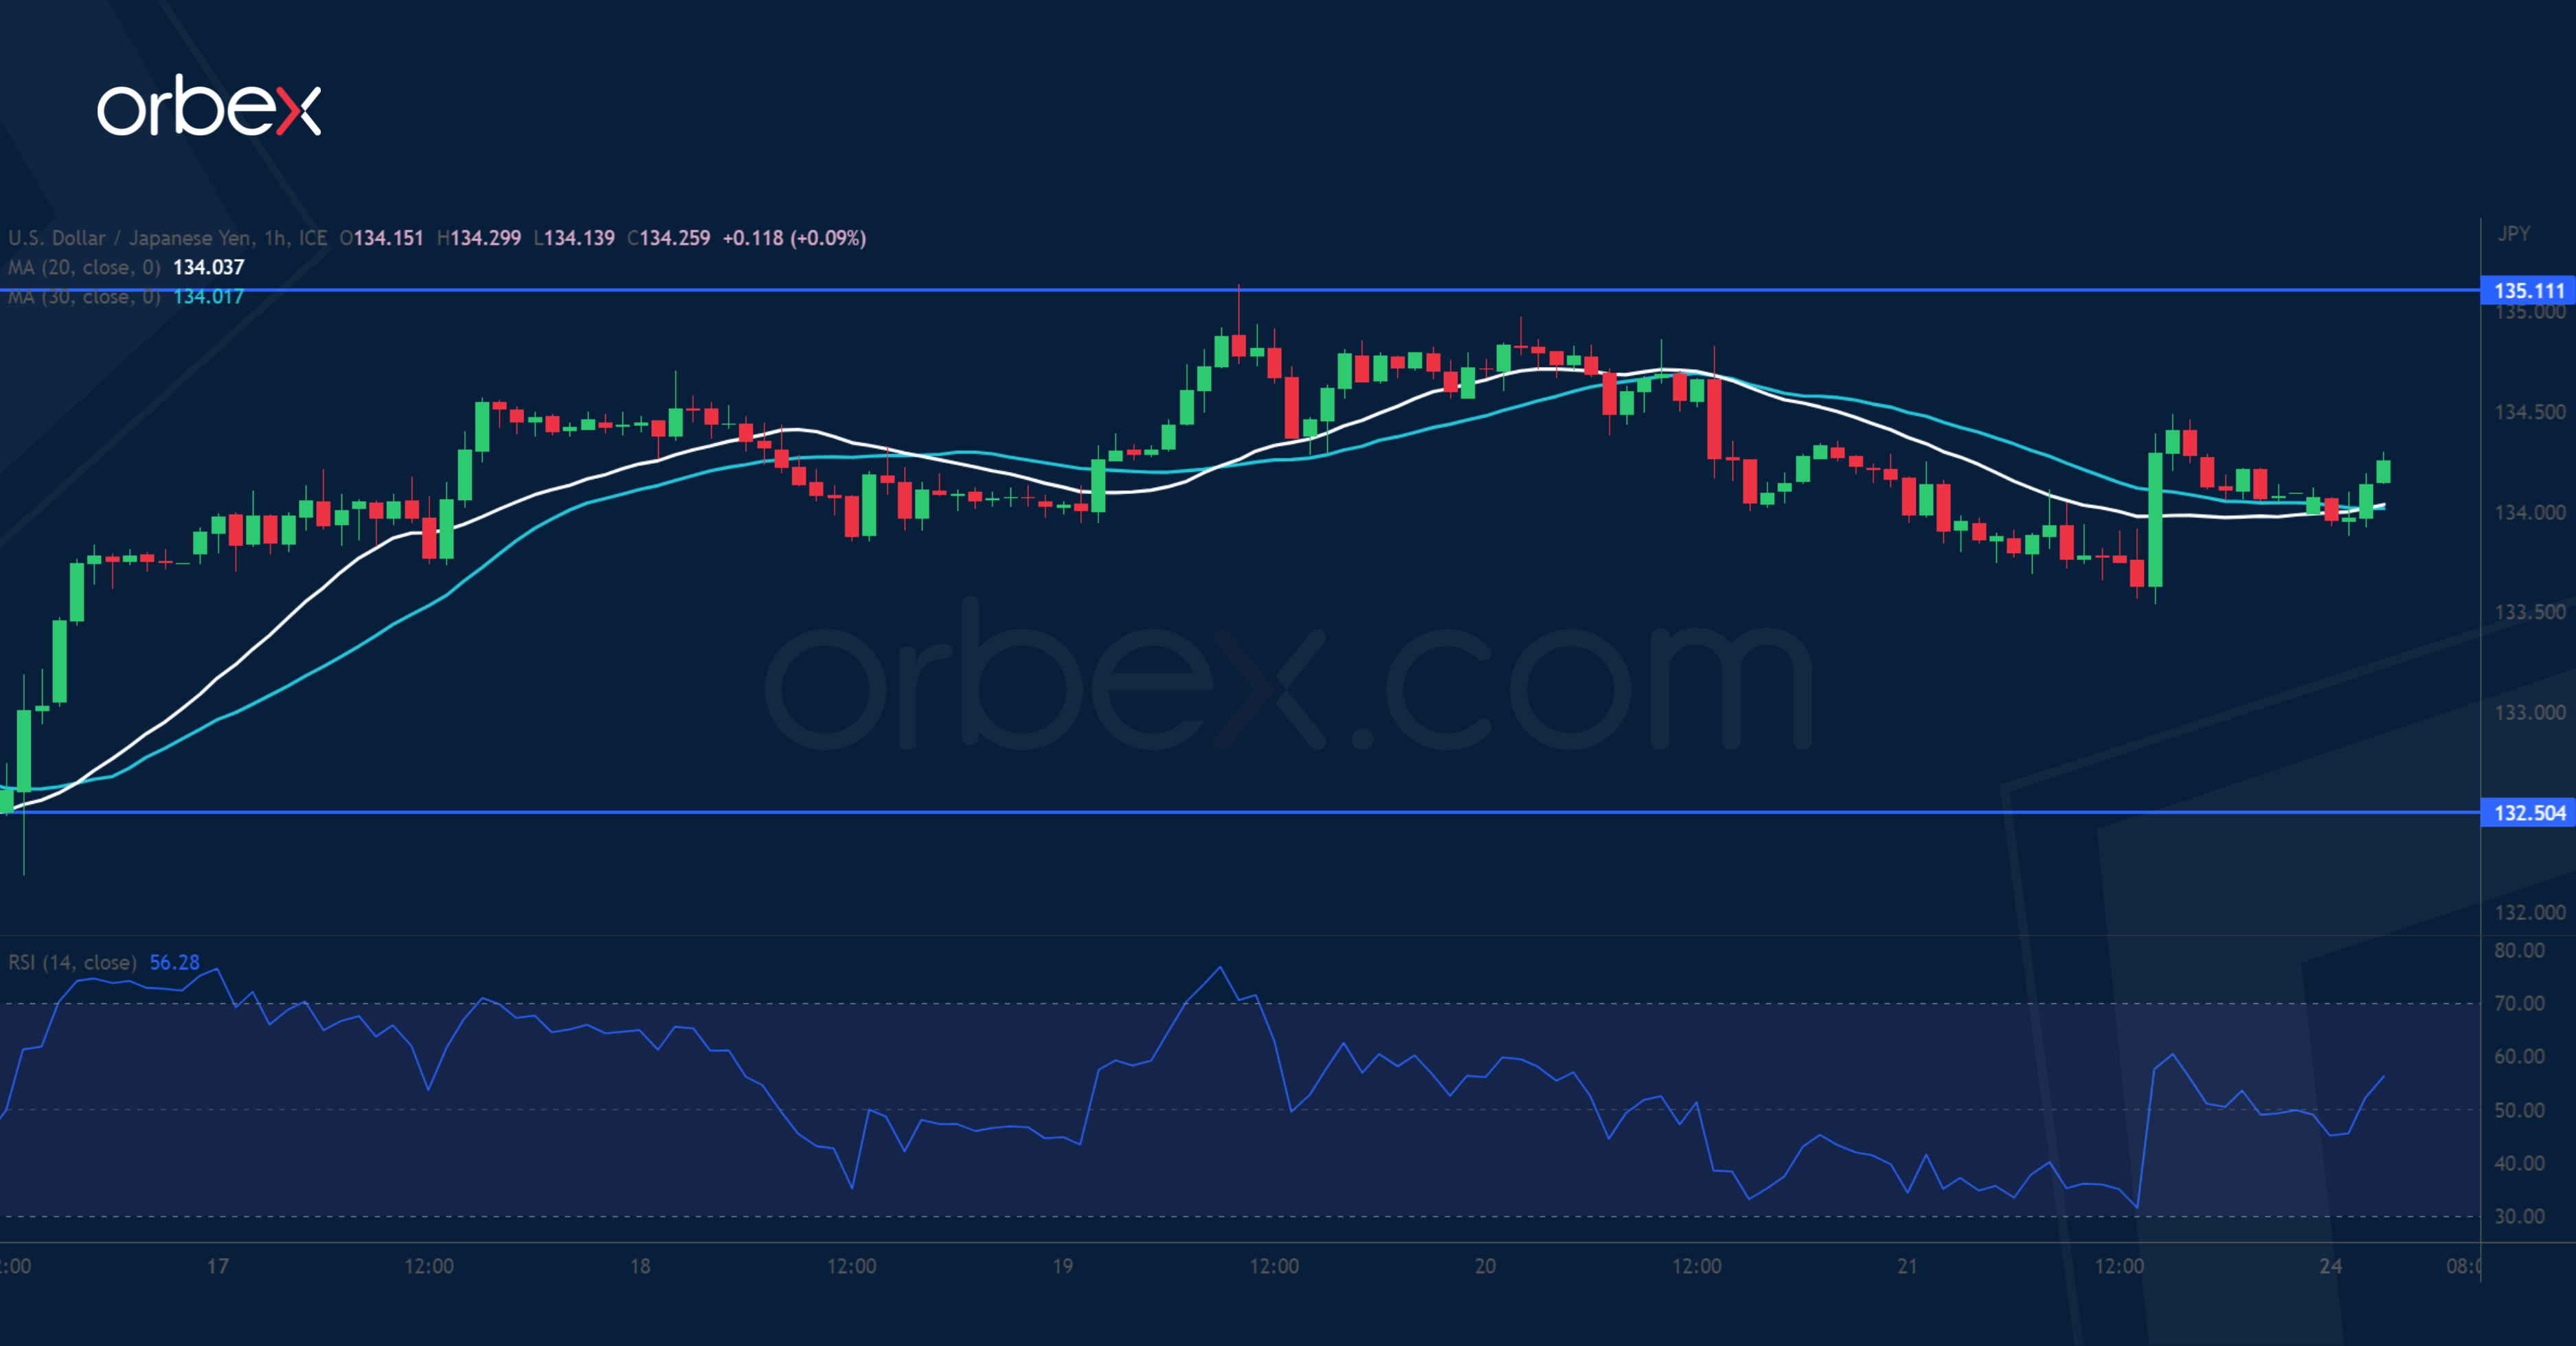
The Japanese yen edged higher as inflation in March gathered speed. The price has met stiff selling pressure at the start of the mid-March sell-off at 135.10. A shooting star pattern in this supply zone carries weight and indicates a strong rejection of that level. A fall below the immediate support and the round number of 134.00 might have given short-term bulls a signal to bag their profits, driving the quote lower. 132.50 is a daily support which coincides with the base of the recent bullish momentum, making it an important floor.
USDCAD breaks key resistance

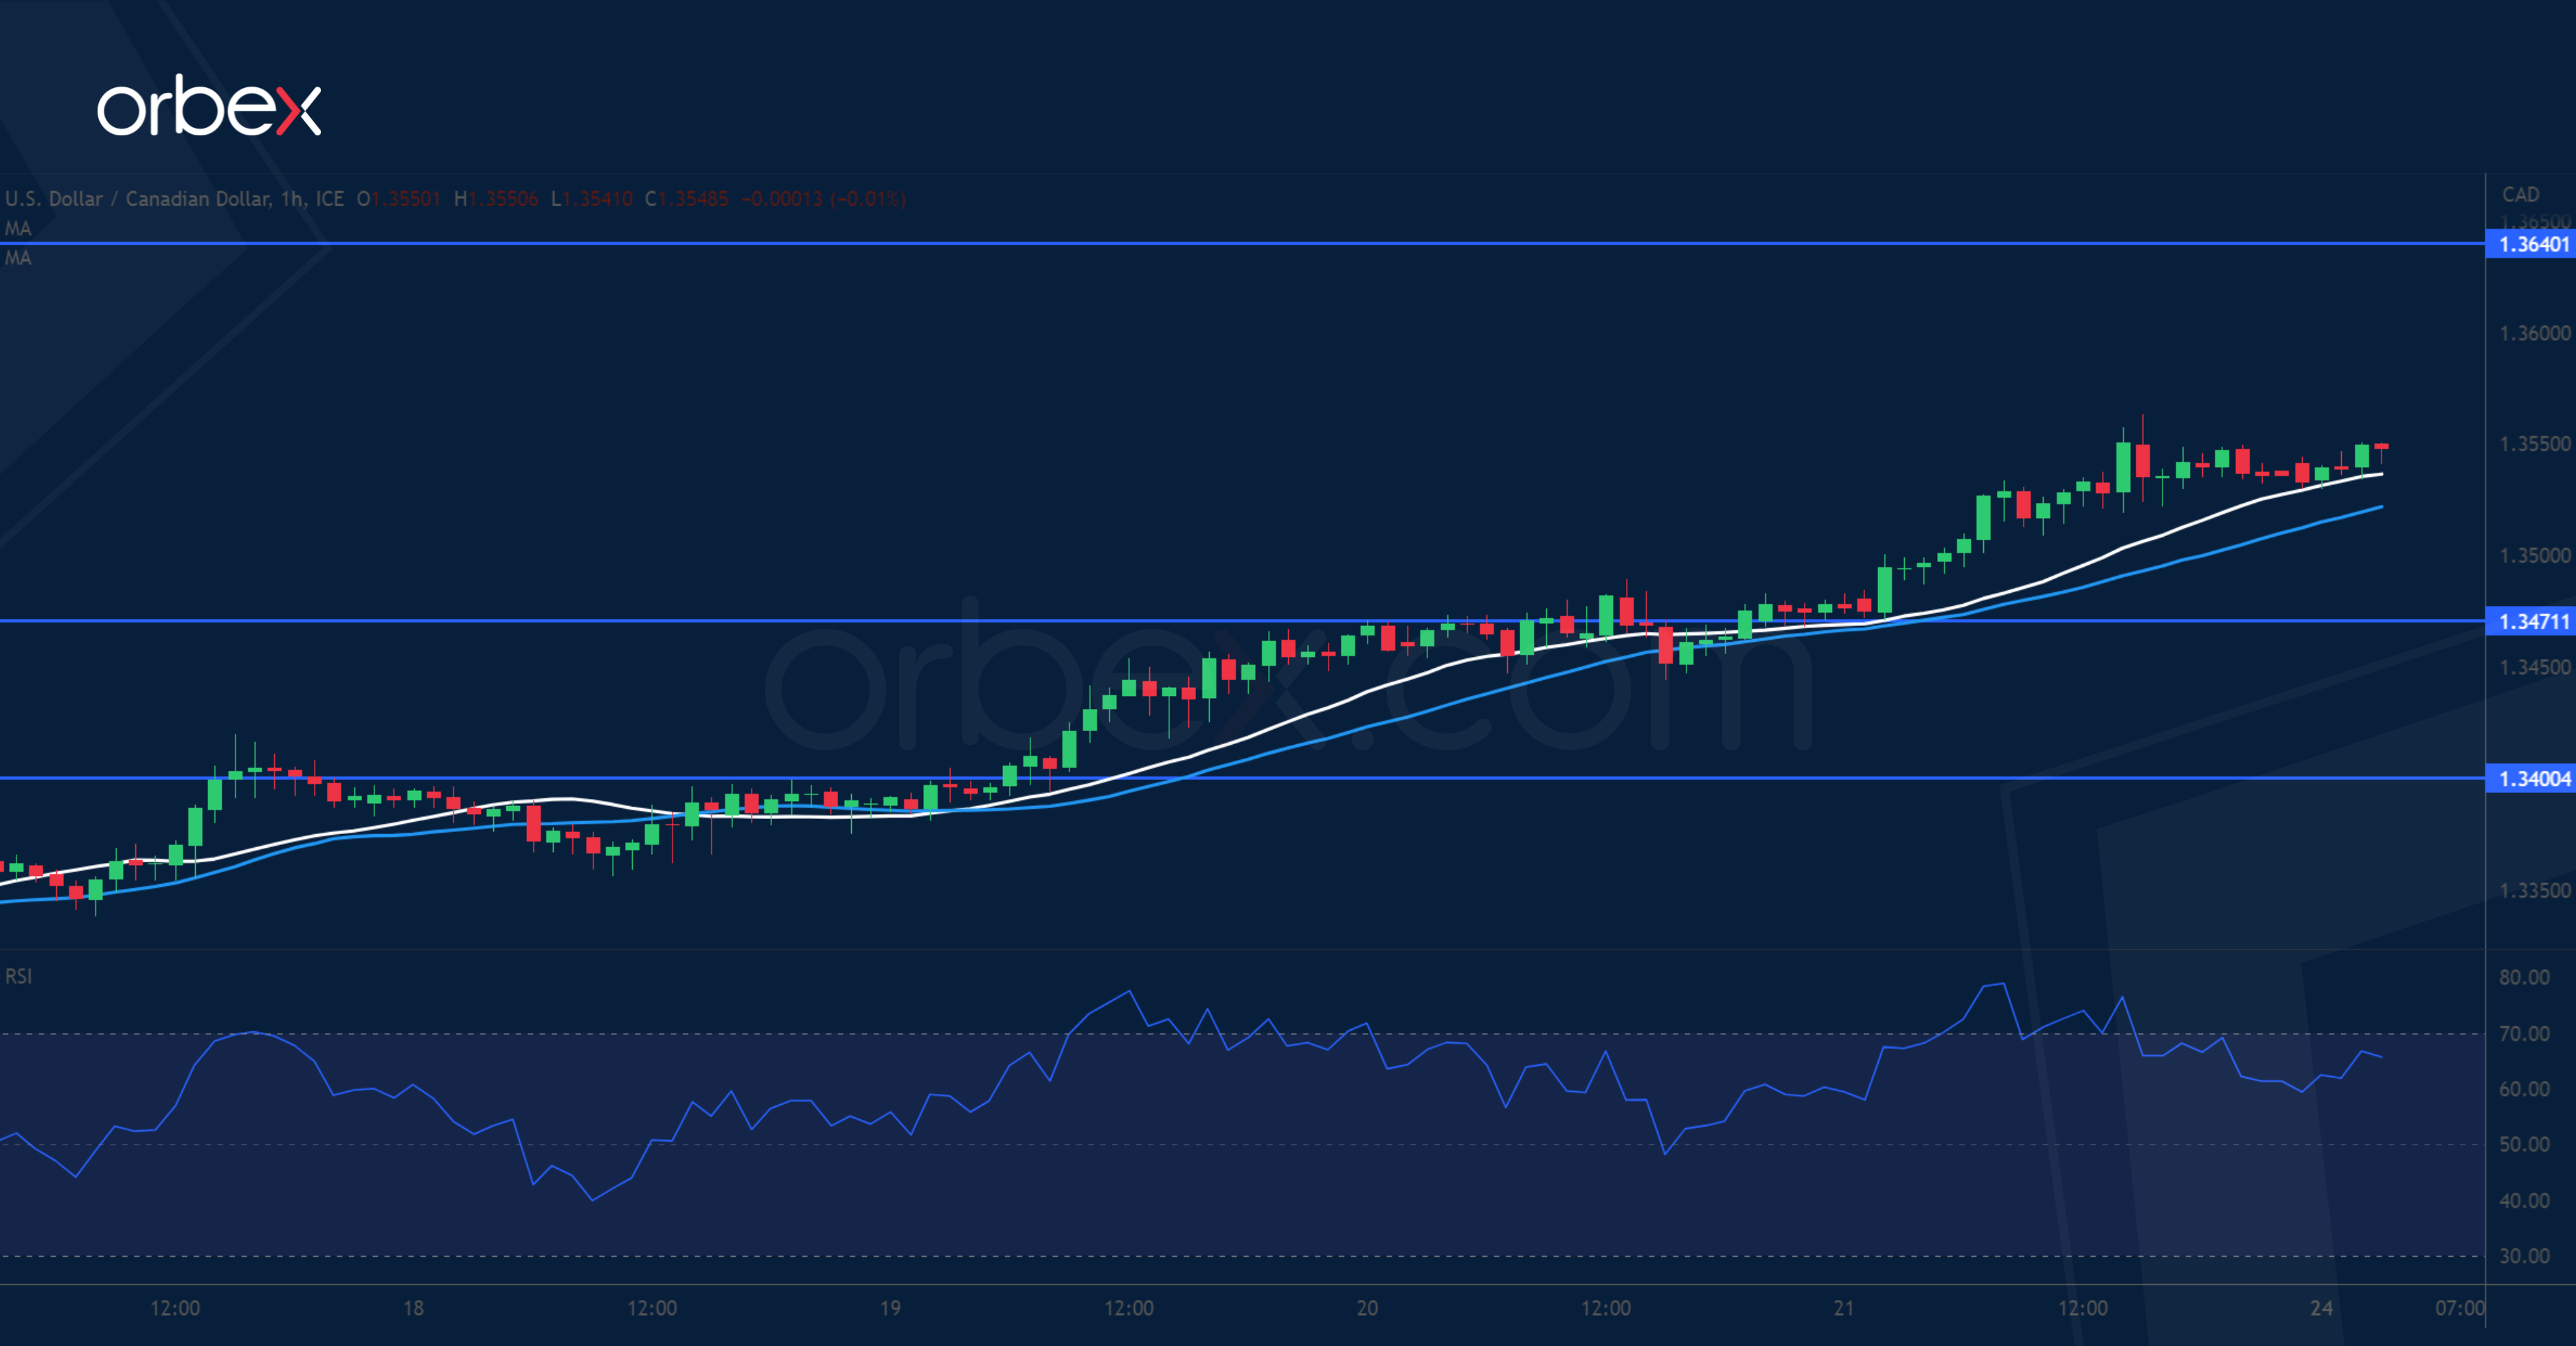
The Canadian dollar slipped after February’s retail sales fell well short of expectations. The pair has bounced back to the previous swing high of 1.3550 next to the 30-day SMA. A tentative breakout has prompted more sellers to cover and could pave the way for a potential extension towards 1.3640 and the recent peak near 1.3840. The RSI’s double top in the overbought area may temper the bullish drive. 1.3470 is the first level to expect a follow-through while 1.3400 is a second line of defence in case of a deeper pullback.
GER 40 finds support
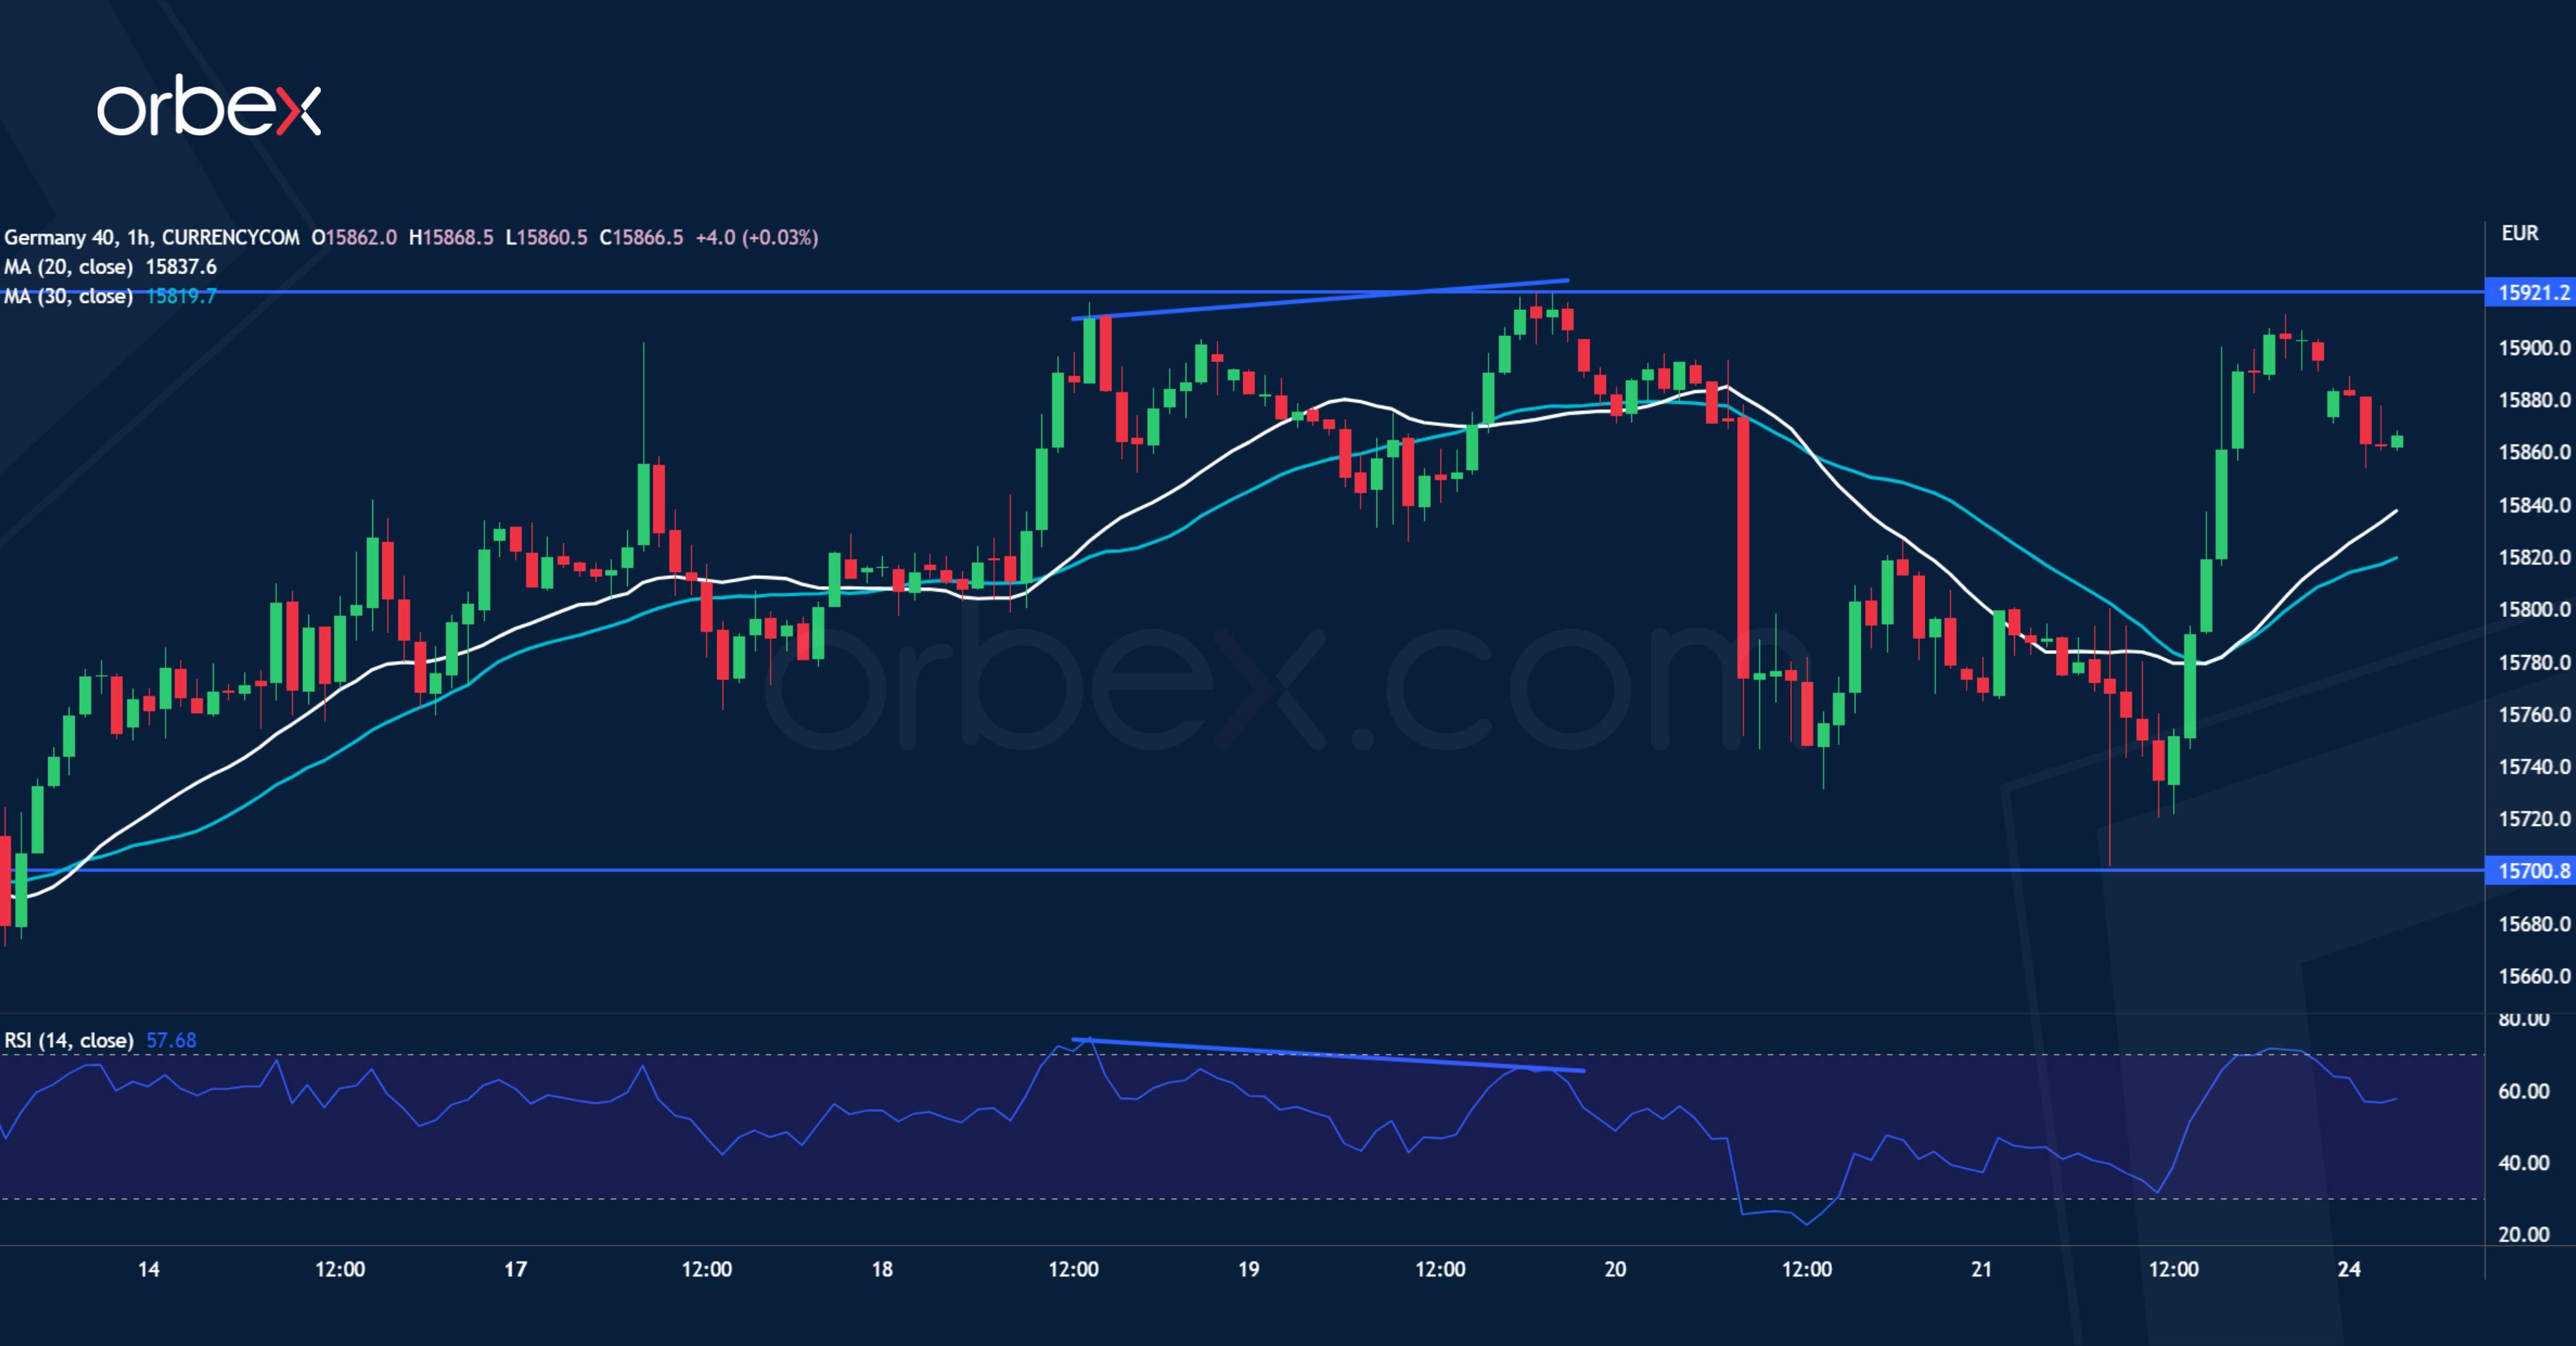
The Dax 40 bounces back on upbeat services PMI across Europe. Despite a bearish RSI divergence showing a slower momentum and a liquidation attempt below 15800, a sharp bounce off 15700 over the 20-day SMA suggests that trend followers were eager to buy the dip. A close above 15920 would resume the current rally and expose the psychological level of 16000 and the all-time high of 16300. On the downside, 15500 at the confluence of a previous swing low and the 30-day SMA is a major level to test the bulls’ resolve.

